
Dashboard Gallery
The dashboards on this page run on synthetic data: a week of API requests and a
week of orders in ClickHouse, and a week of background worker logs in
VictoriaLogs. Each section says what the dashboard answers, lists the
dashboard features it uses, and shows a panel query you
can copy. The scripts that build the data, the dashboards and these screenshots
are in dev/gallery.
API health
Section titled “API health”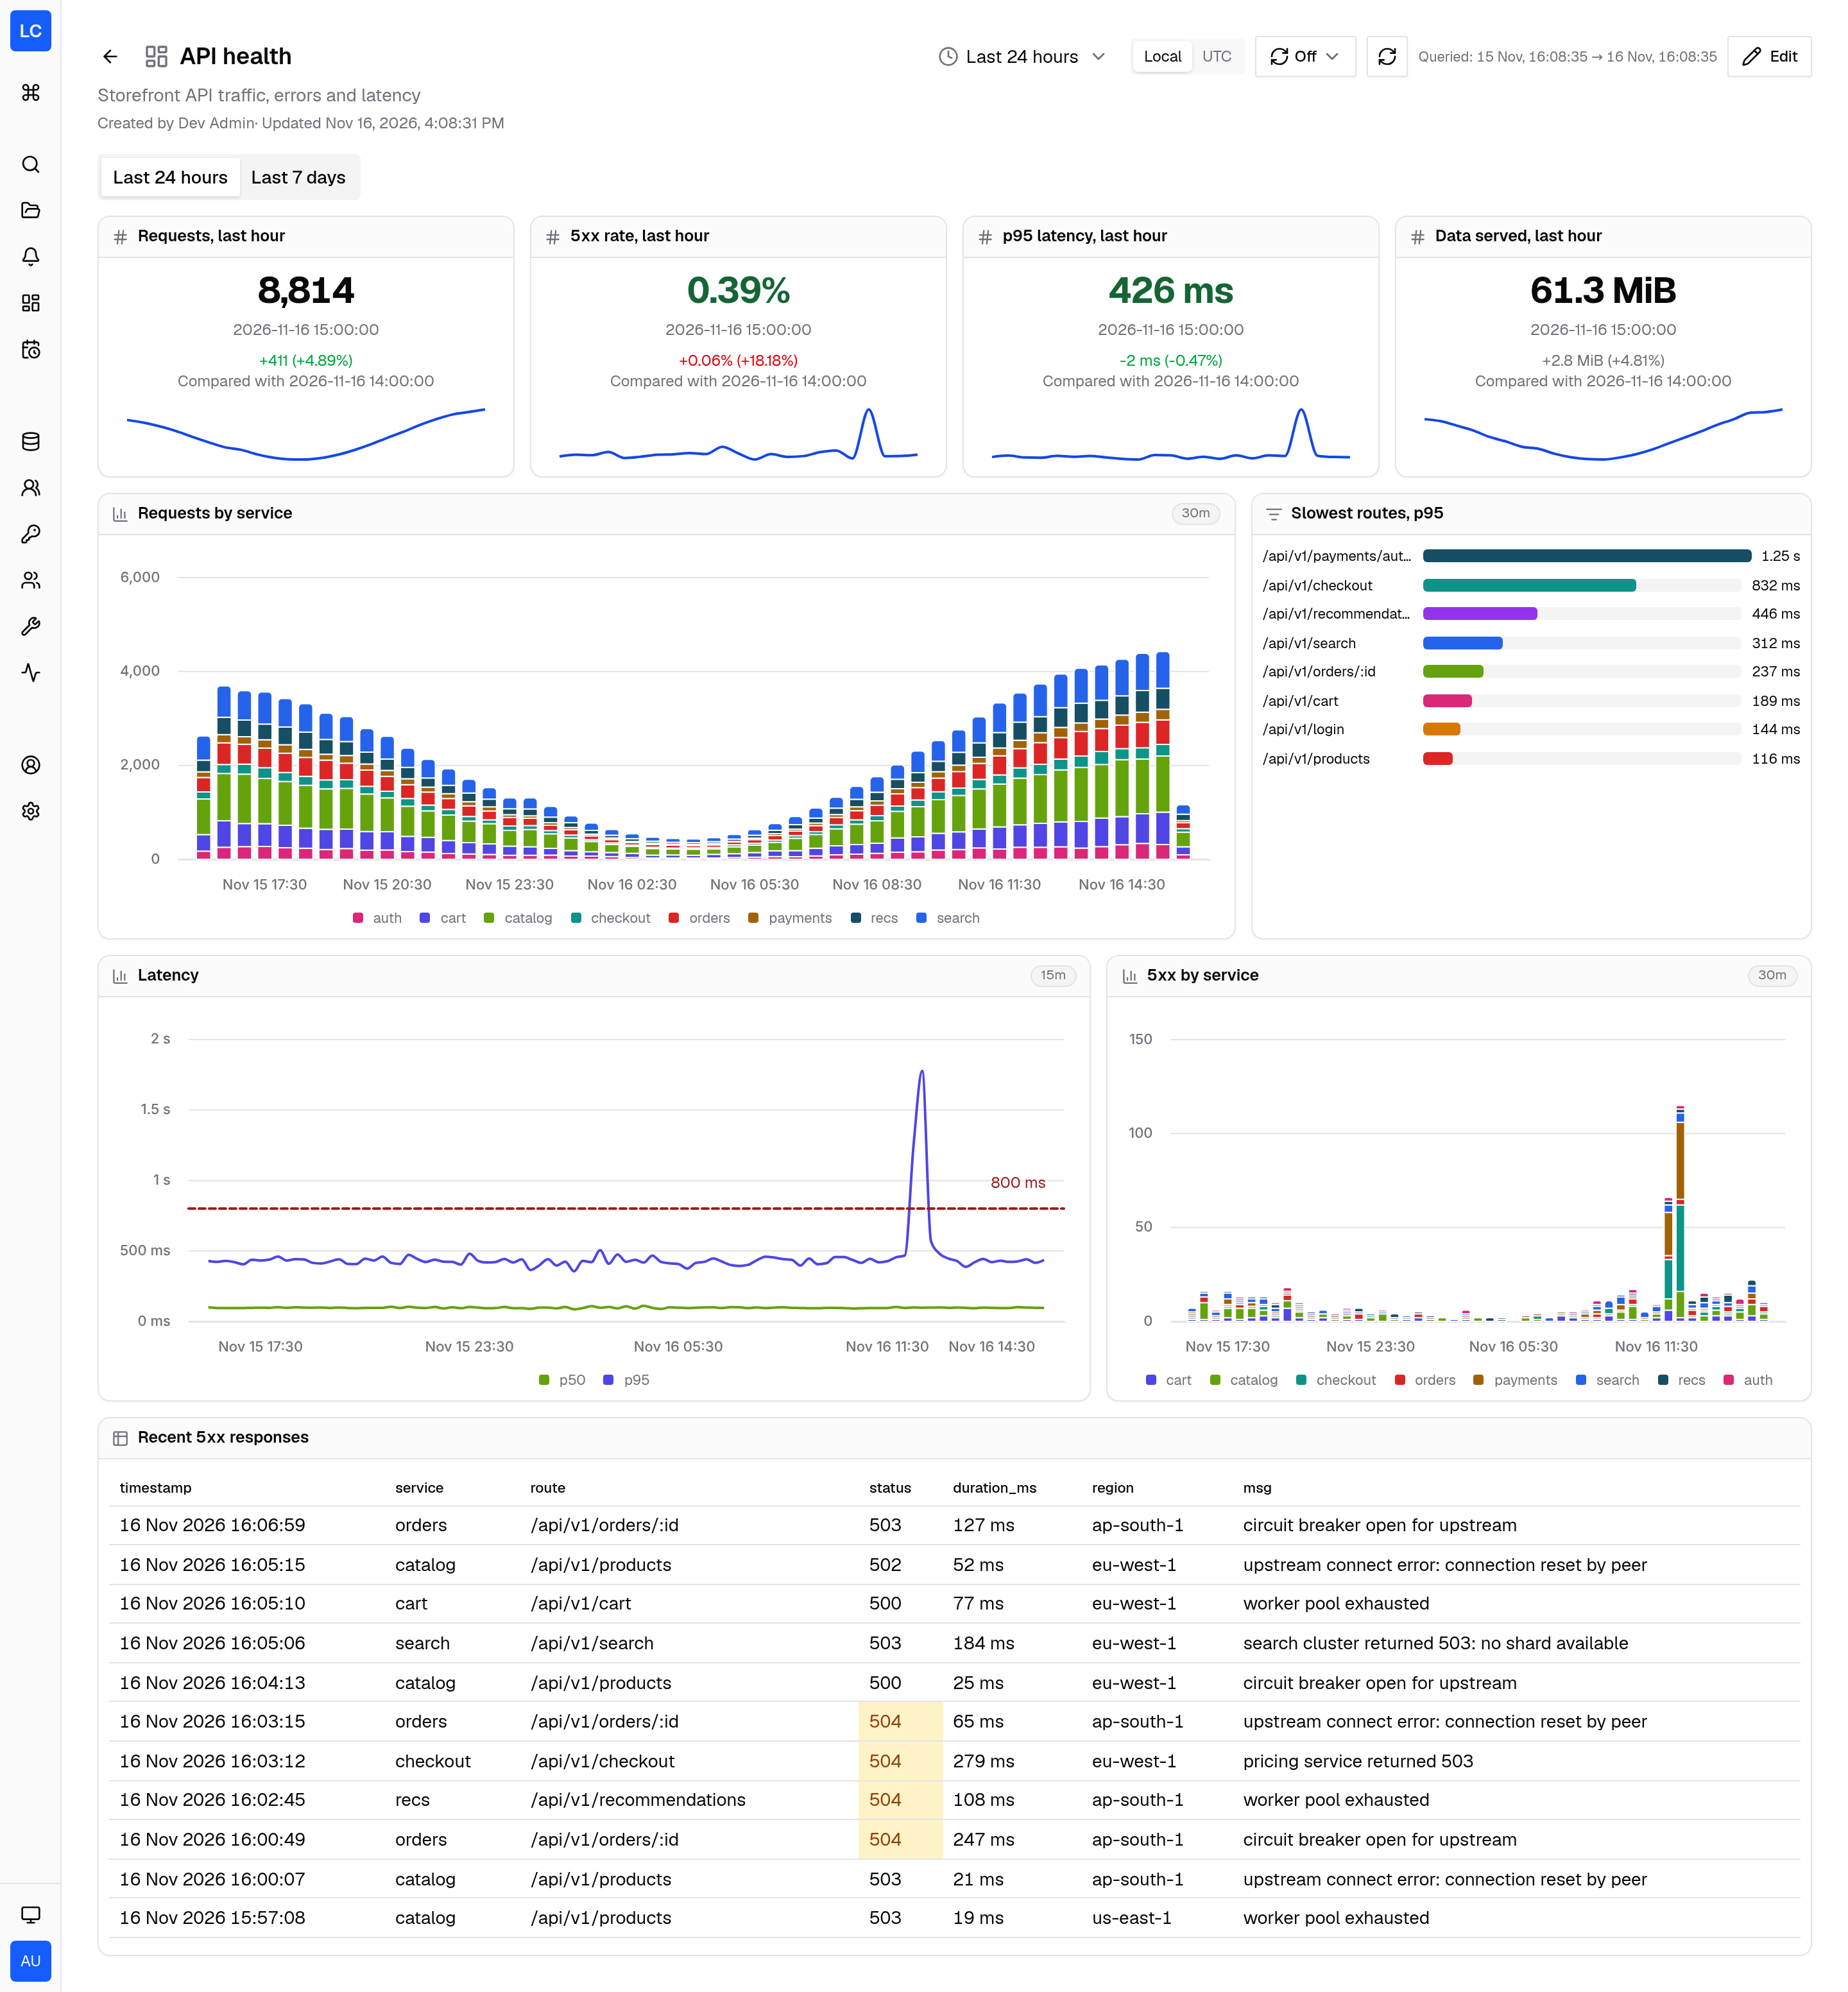
A wall screen for the team that runs the storefront API. The top row answers “how did the last whole hour compare with the one before it”. The charts below cover the last 24 hours. The 5xx and latency charts show an incident three and a half hours earlier, when checkout and payments failed.
It uses:
- Stats with a comparison and a sparkline, colored green or red by the direction that counts as better
- Thresholds that color the 5xx rate and p95 values, and an 800 ms reference line on the latency chart
- Result charts: stacked bars, lines and a toplist, all drawn from SQL results
- A fixed bucket size per chart, 30 minutes for the bars and 15 minutes for the latency lines
- Table rules and column formats: a 504 cell turns amber, a row whose message contains “timed out” turns purple, and timestamps show seconds
- Panel widths of 7 and 5 columns, which the free grid allows
- Two tabs
Each stat tile runs one row per hour and leaves out the hour in progress, so
the comparison is between two whole hours. HAVING drops the first hour, which
the range start cuts in half:
SELECT toStartOfHour(timestamp, {{__timezone}}) AS hour, round(quantile(0.95)(duration_ms)) AS p95_msFROM gallery.http_requestsWHERE {{__time_filter}} AND timestamp < toStartOfHour(now(), {{__timezone}})GROUP BY hourHAVING hour > {{__from}}ORDER BY hourThe tile uses p95_ms as the value, hour as Order by, the last
reducer, Previous row as the comparison and Decrease as the improvement
direction.
The last 7 days tab
Section titled “The last 7 days tab”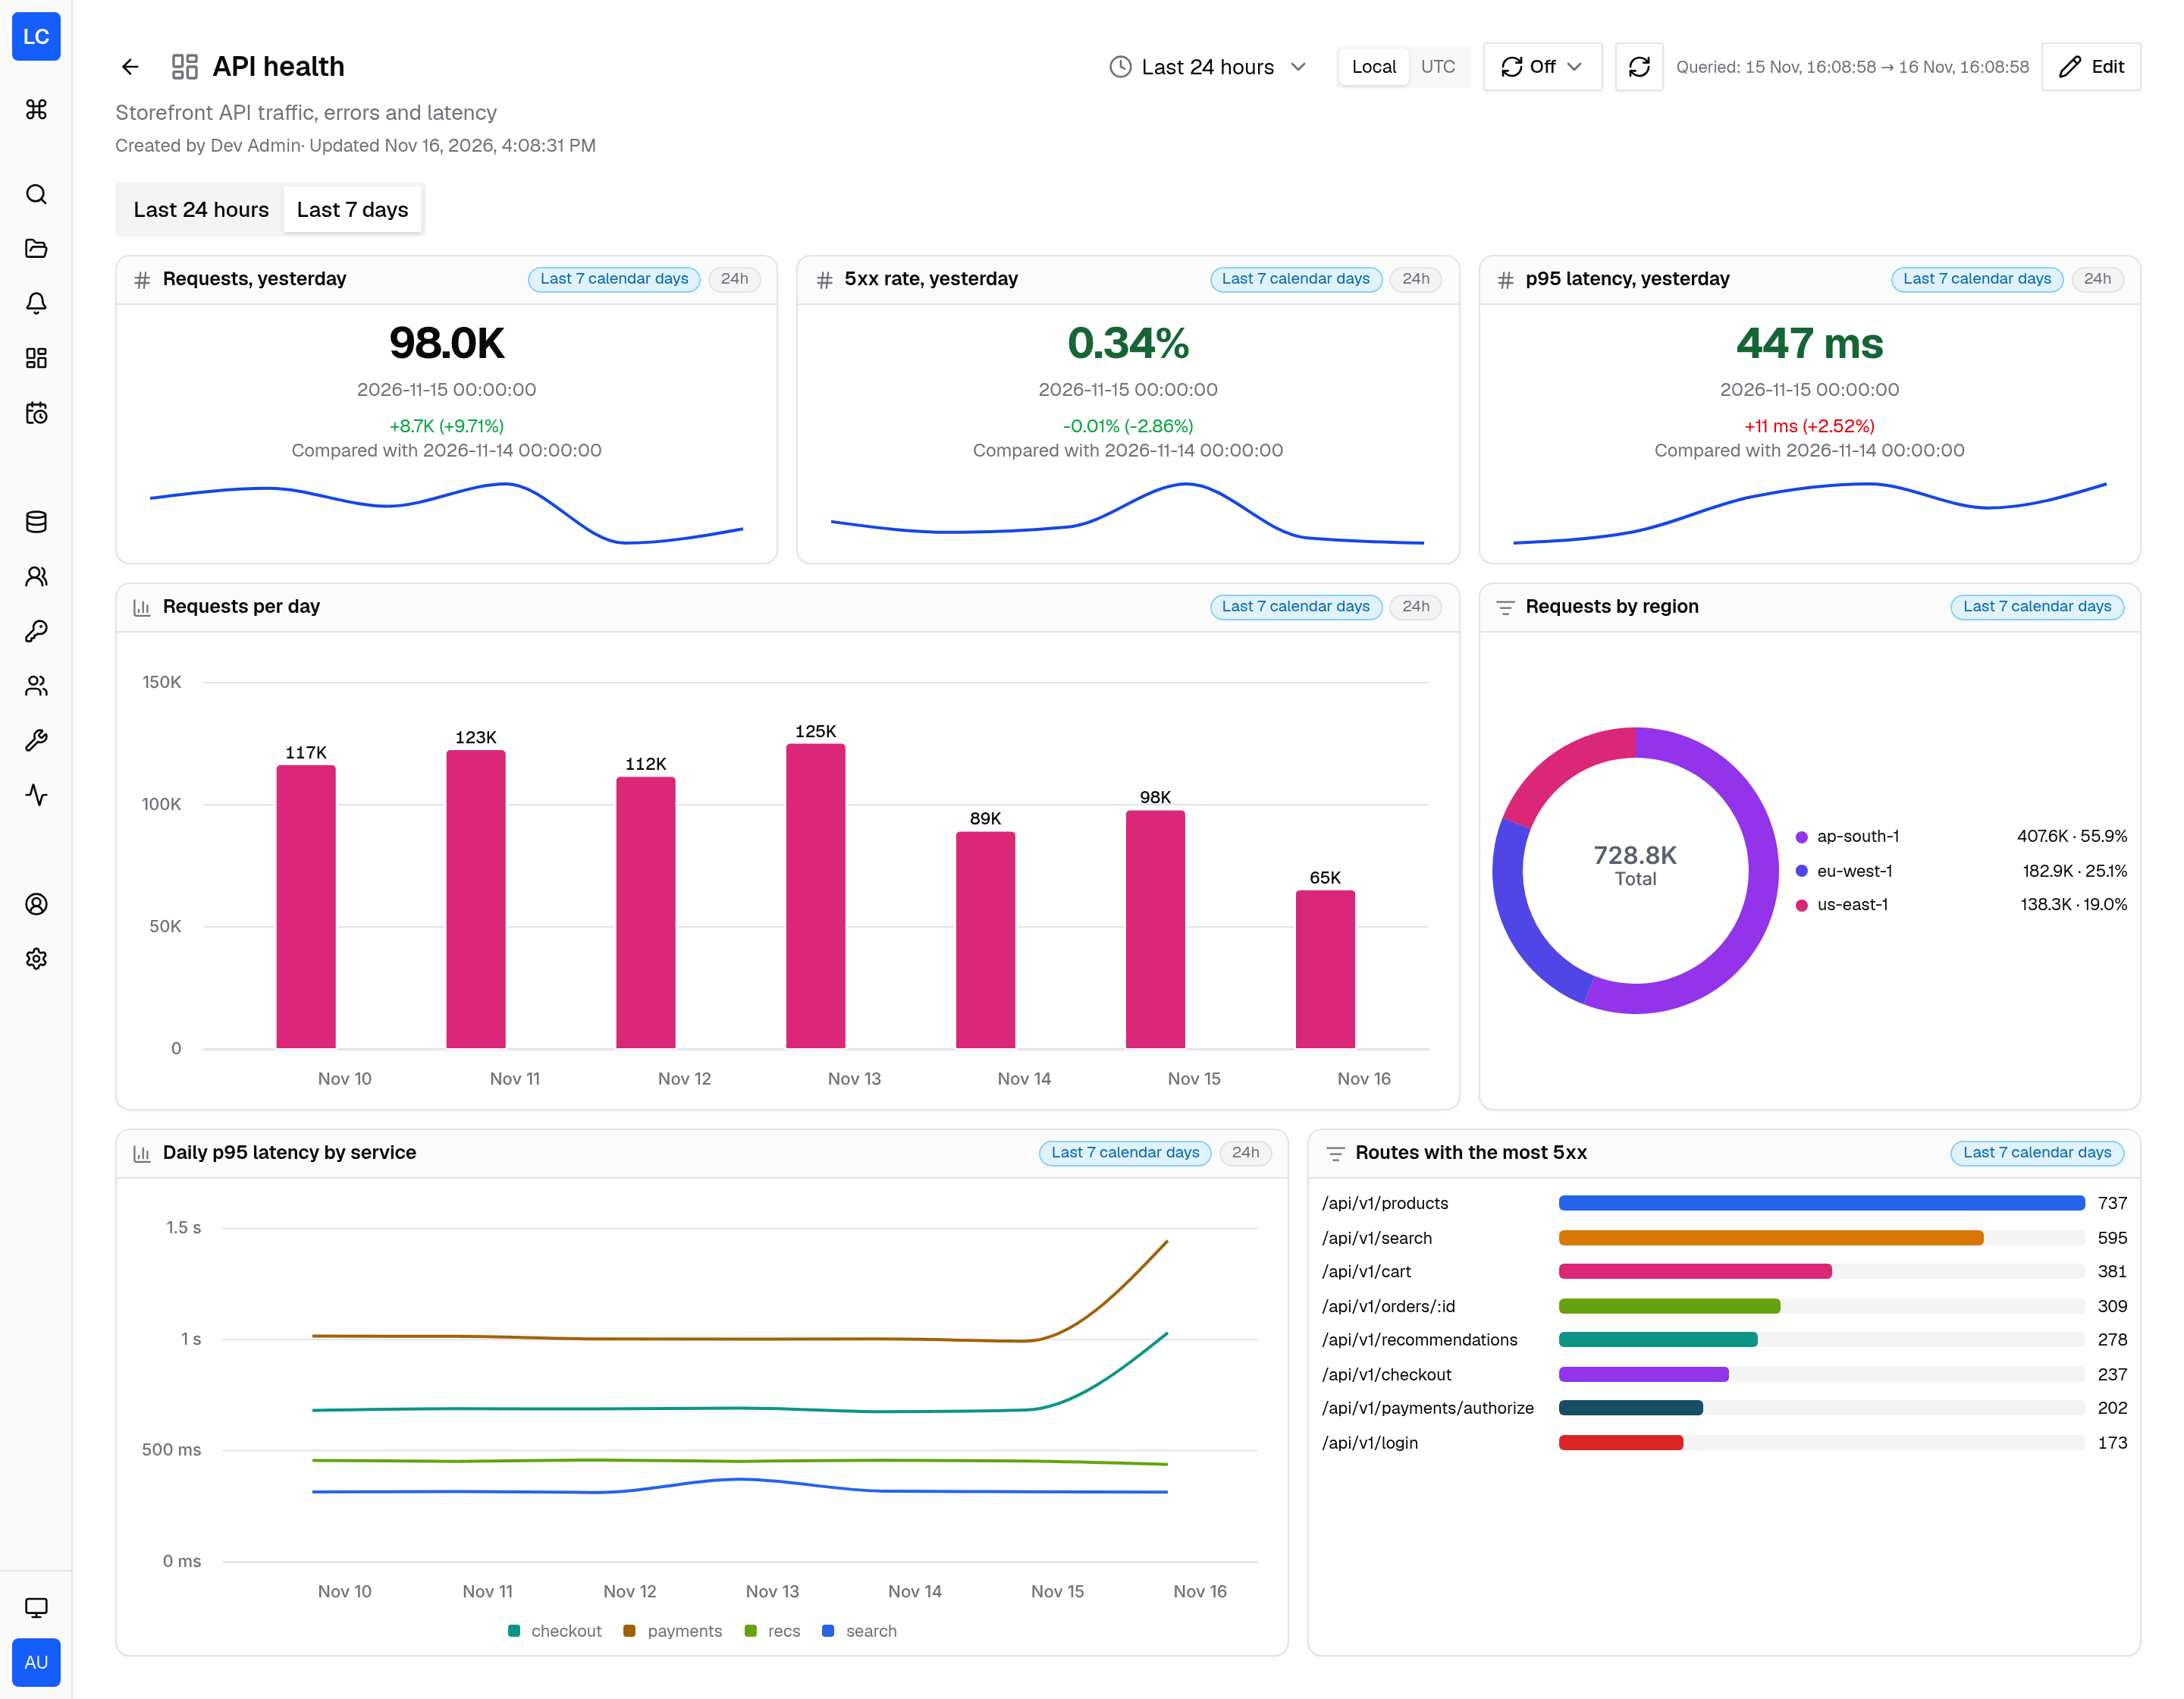
The second tab answers “how does this week look”. The dashboard opens on the
last 24 hours, but every panel on this tab sets its own
range of today-6d, which is
today and the six days before it in the viewer’s timezone. The charts use
24h buckets, so each bar is one calendar day. The stats leave out today and
compare yesterday with the day before. The chips in each panel header show the
range and the bucket size.
Business KPIs
Section titled “Business KPIs”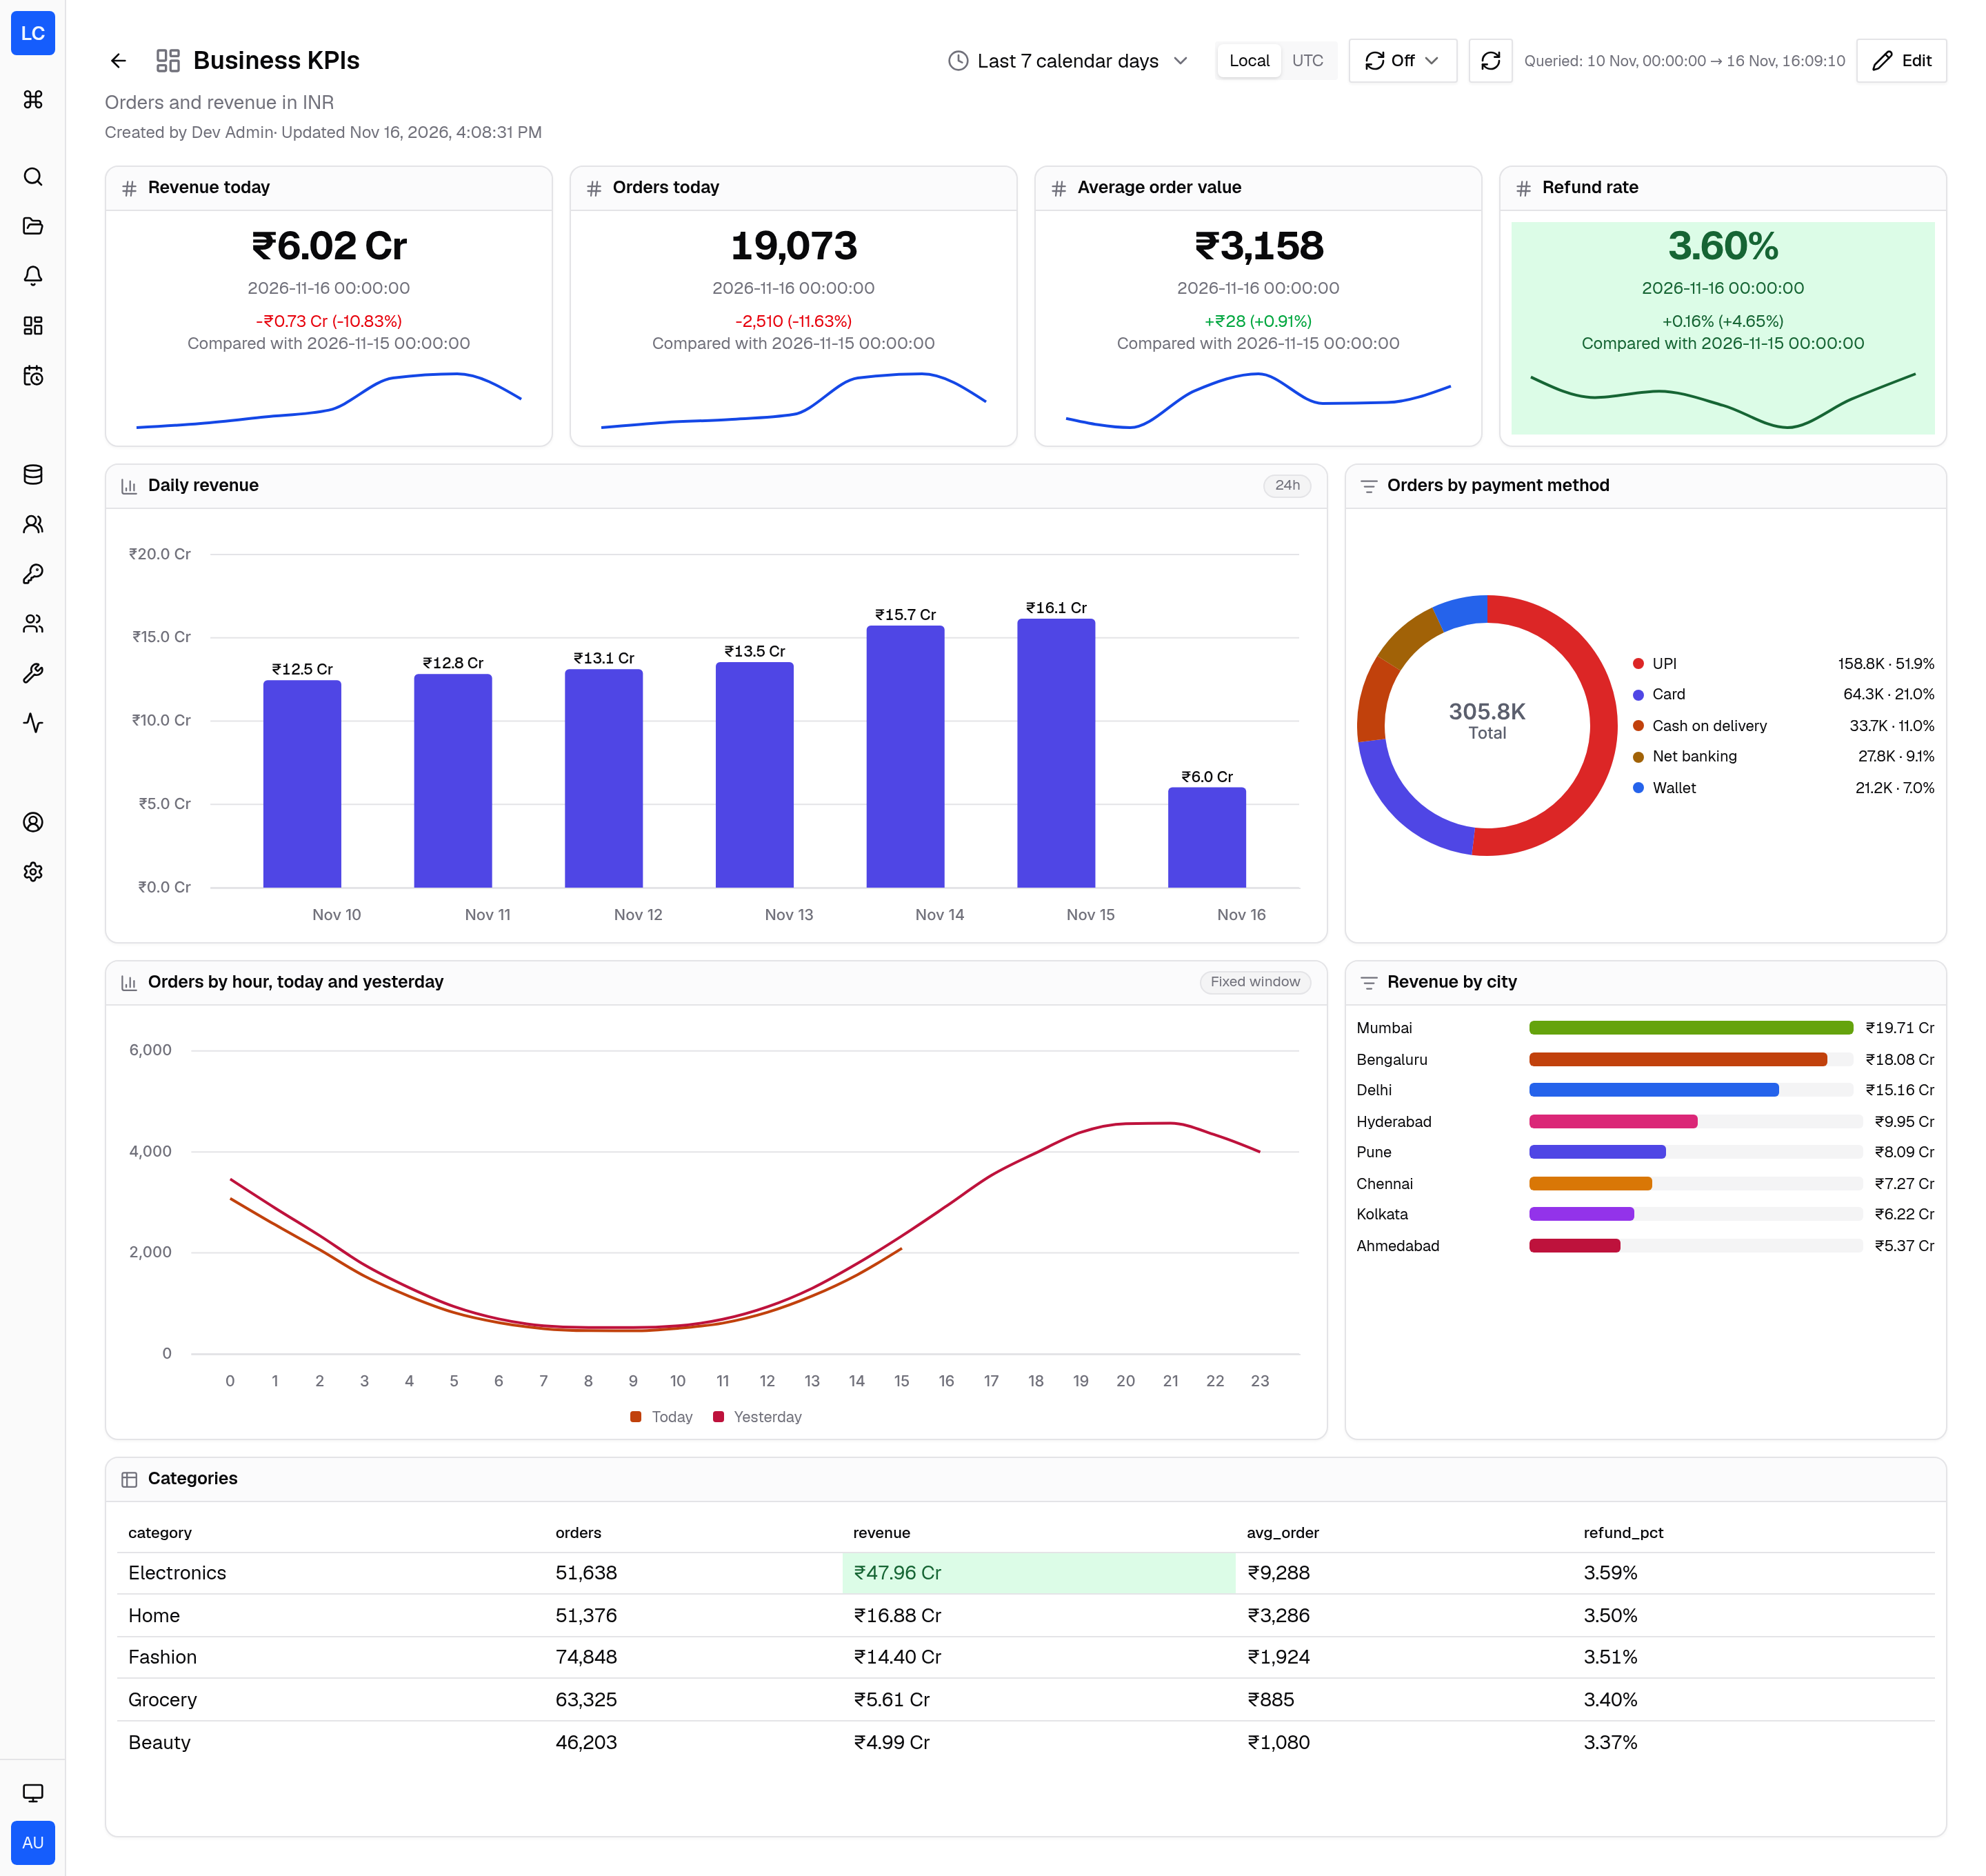
A dashboard for the people who ask “are we selling more than yesterday”. Amounts are in rupees and revenue reads in crores. The dashboard opens on the calendar range Last 7 calendar days.
It uses:
- Number formats with
Scale
1e-7, Prefix₹and SuffixCr, so 52,900,000 shows as ₹5.29 Cr - A background threshold on the refund rate: green below 4%, amber from 4%, red from 6%
- Bars with value labels above each bar, a donut and a toplist
- A category X scale for the hour of day, with one line for today and one for yesterday
- A Fixed window chip on the hourly chart, because its SQL sets its own window instead of using a time macro
- Cell rules that mark revenue of ₹40 Cr or more and a refund rate of 3.6% or more
A comparison of today with yesterday at 3 pm should not use all of yesterday. The stat tiles count each day only up to the current time of day:
SELECT toStartOfDay(created_at, {{__timezone}}) AS day, sumIf(amount, status = 'paid') AS revenueFROM gallery.ordersWHERE {{__time_filter}} AND dateDiff('second', toStartOfDay(created_at, {{__timezone}}), created_at) <= dateDiff('second', toStartOfDay(now(), {{__timezone}}), now())GROUP BY dayORDER BY dayThe last row is today so far, and the row before it is yesterday up to the same minute. The sparkline shows the same slice of each of the last seven days.
Worker logs
Section titled “Worker logs”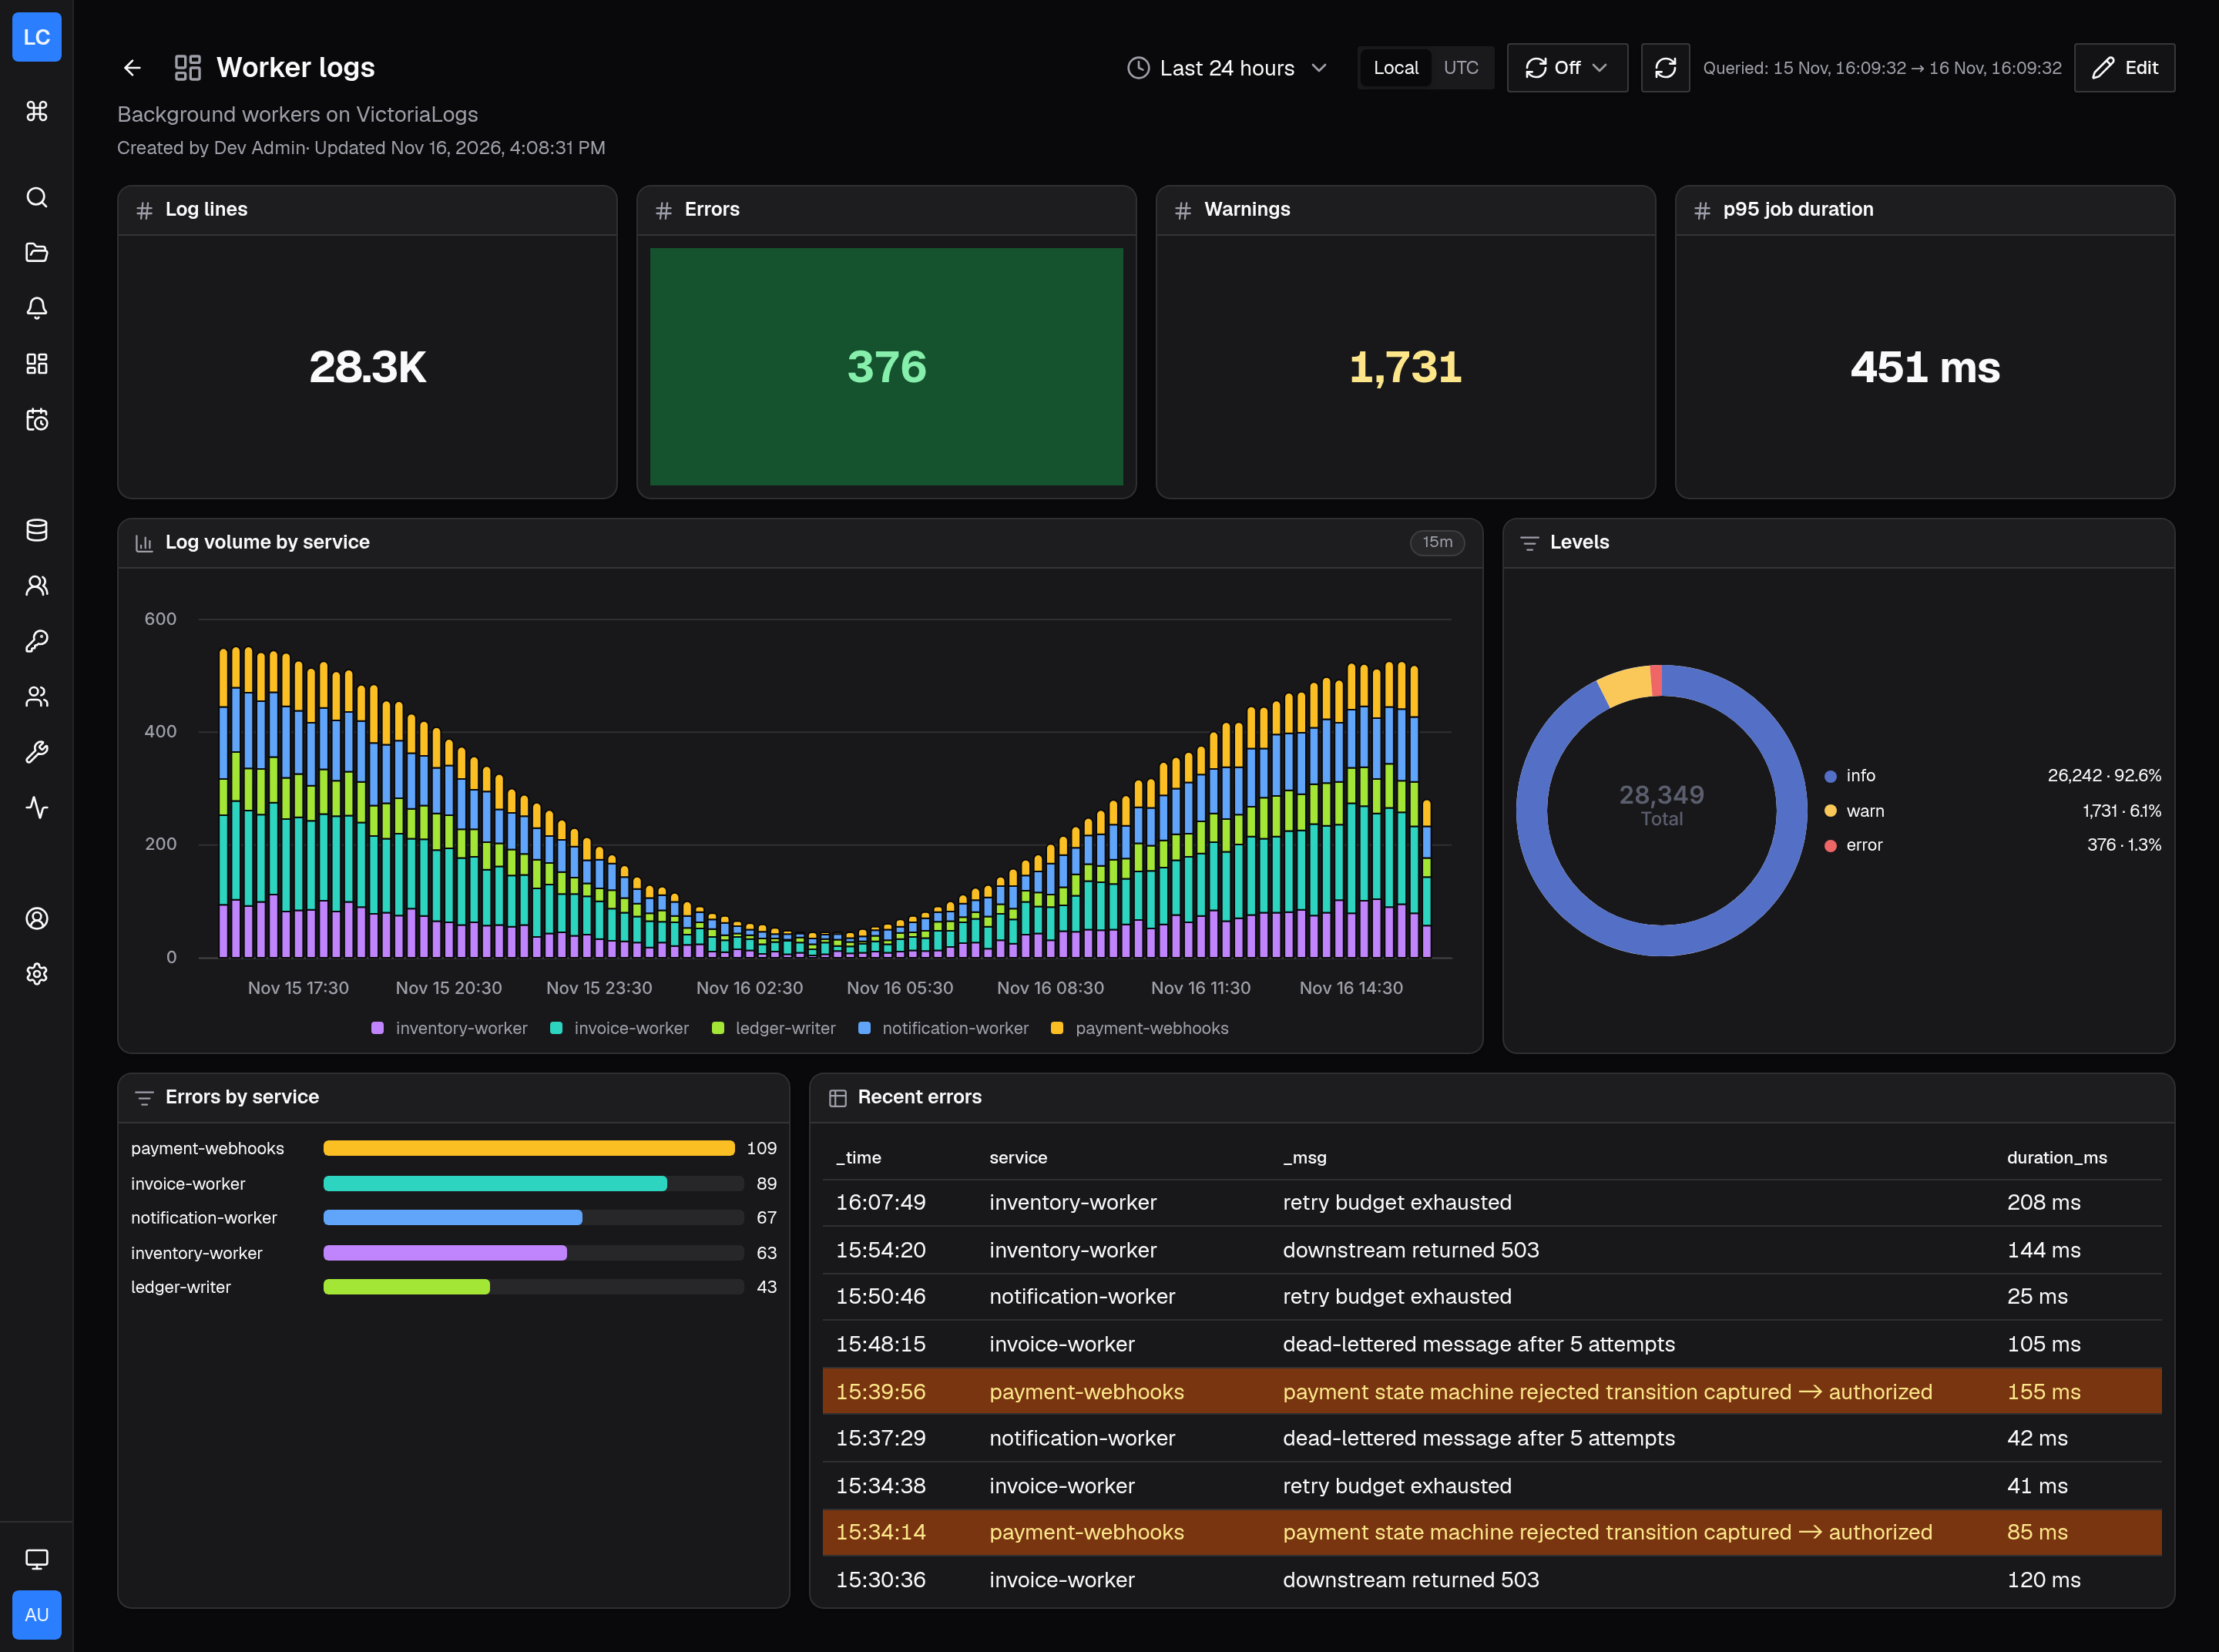
A dashboard for the on-call engineer who owns the background workers, on a VictoriaLogs source. It mixes count panels written in LogchefQL with result panels written in LogsQL.
It uses:
- Count mode with group by for the stats,
the stacked bars and the levels donut, which run filters such as
level="error"through the histogram endpoint - LogsQL result panels for the p95 duration, the errors toplist and the recent errors table
- Confirmed column kinds,
because VictoriaLogs returns every field as text:
duration_msis a number and_timeis a time - A background threshold on the error count, and a row rule that marks
payment-webhookserrors amber
The errors toplist is one LogsQL stats query:
level:error | stats by (service) count() as errors | sort by (errors desc)Build a panel
Section titled “Build a panel”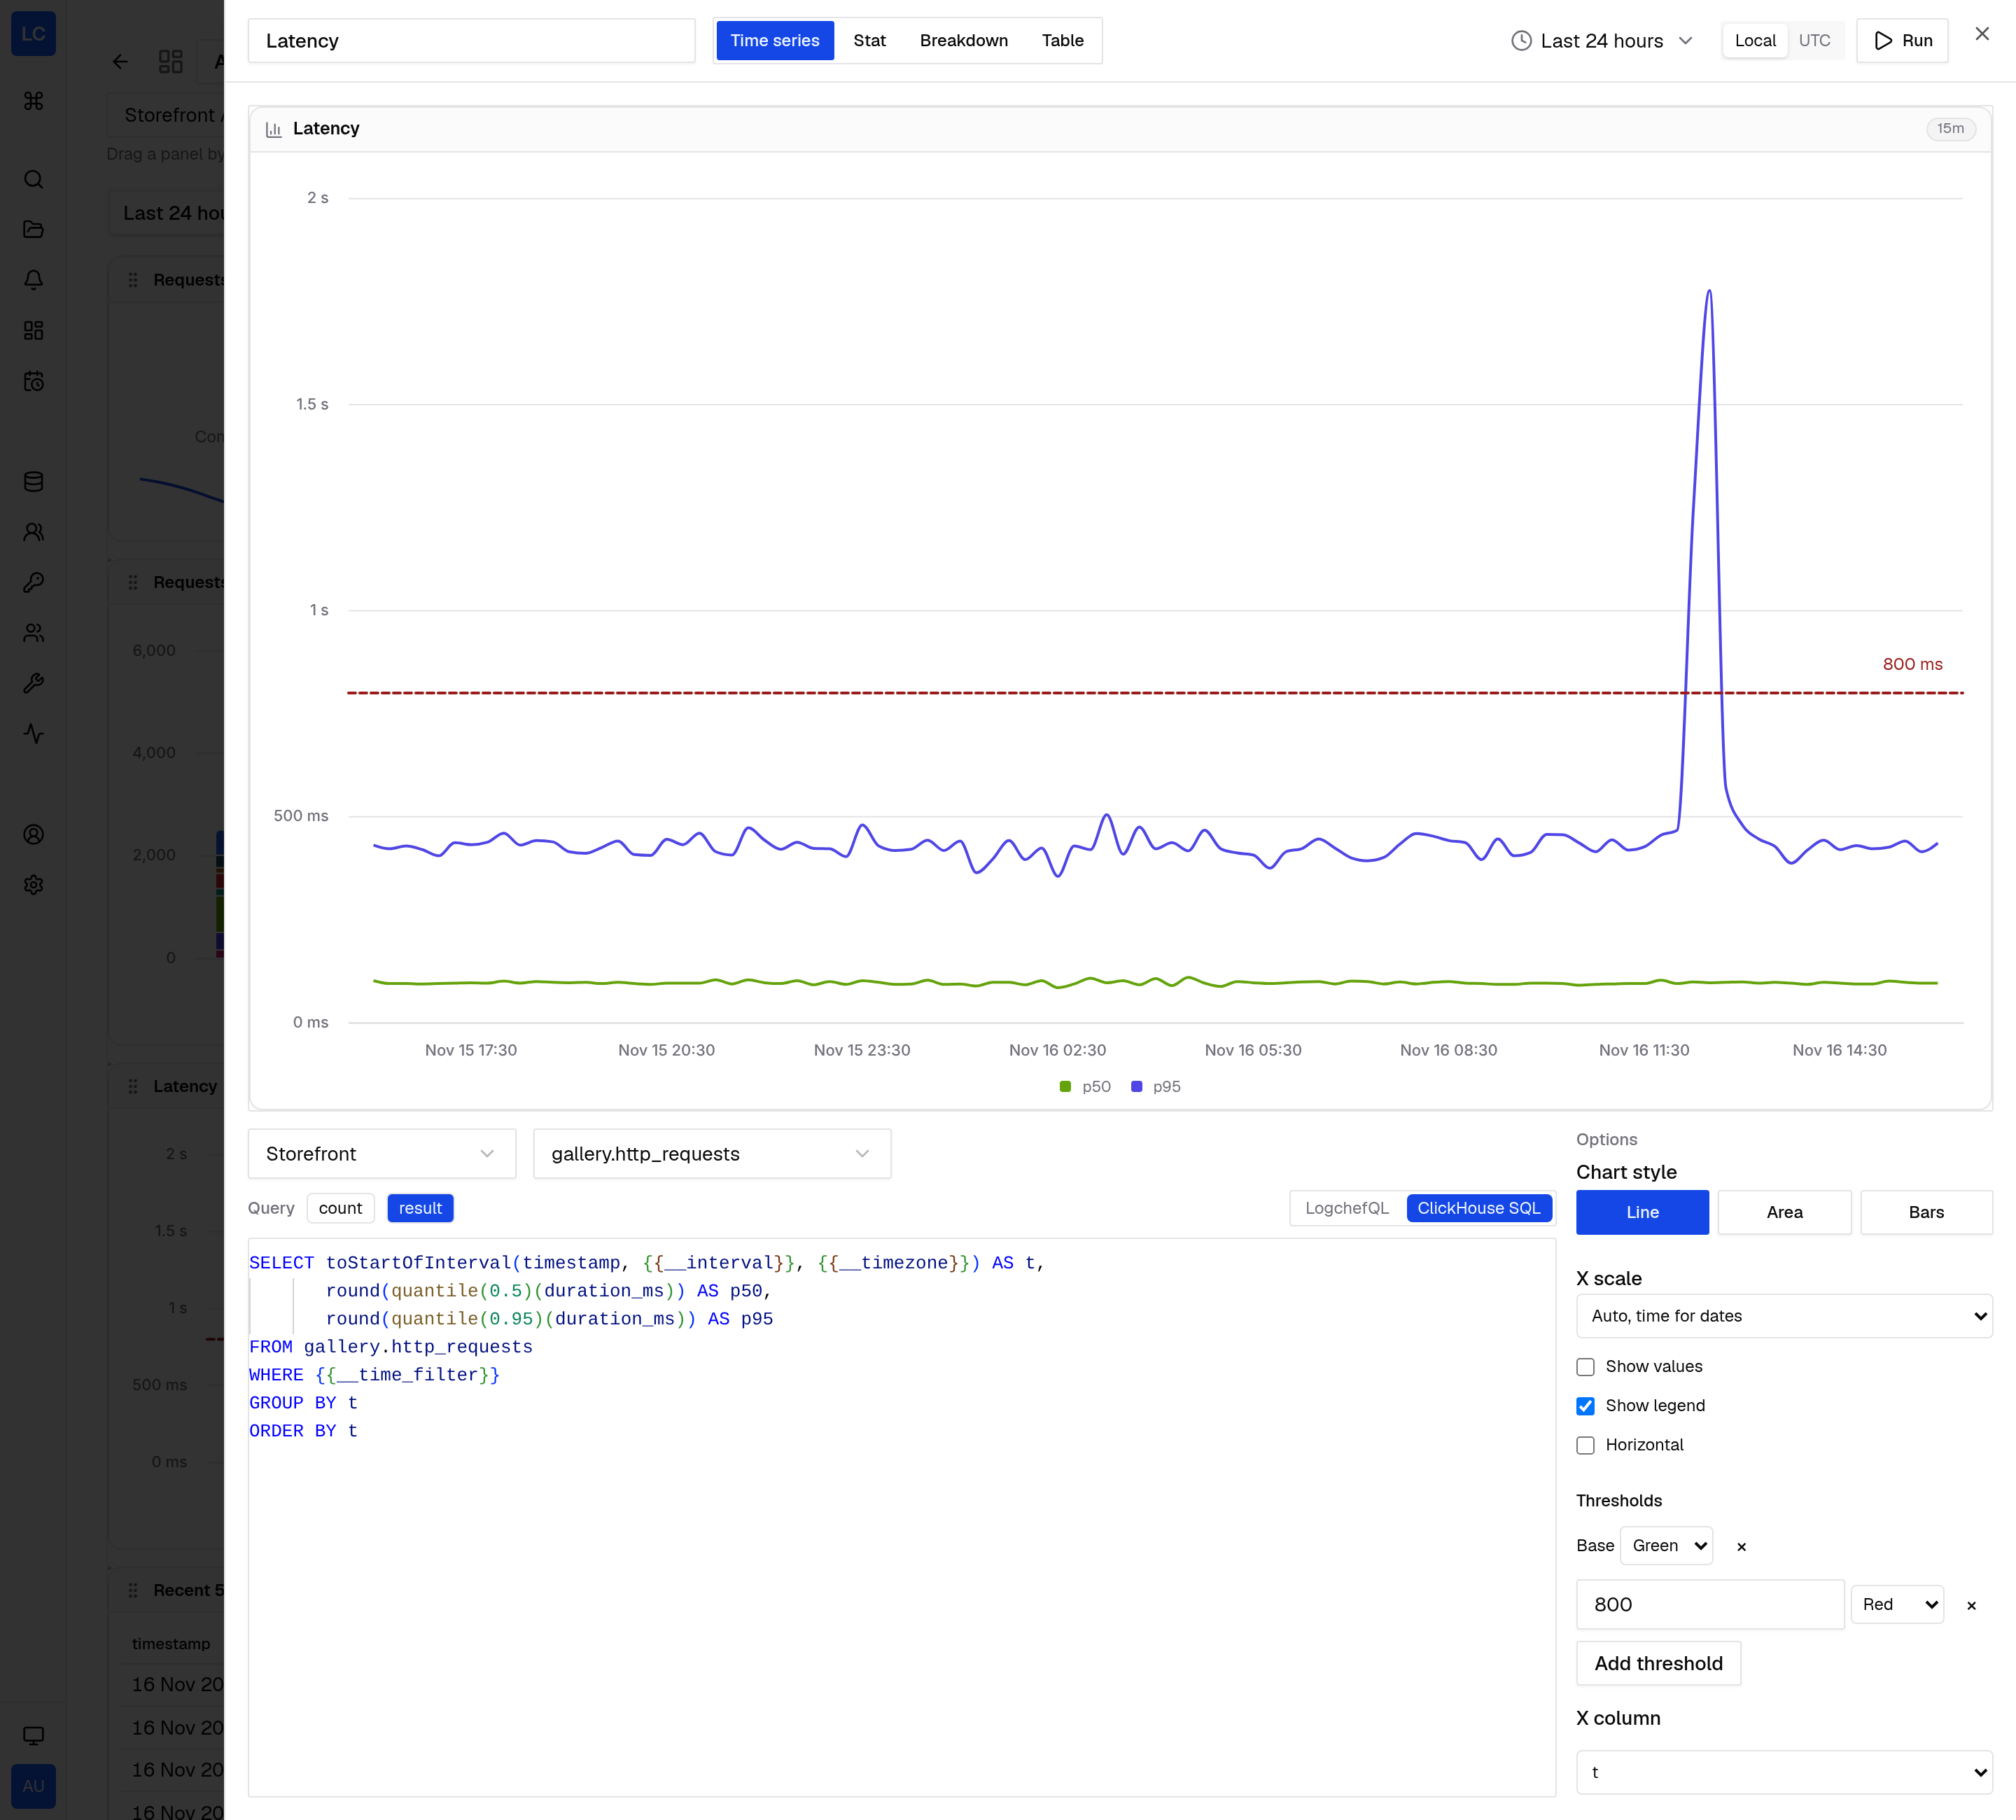
The panel builder shows a live preview above the query. For the Latency panel the options column holds the chart style, the X scale, value labels, the legend and the thresholds that draw the 800 ms line.
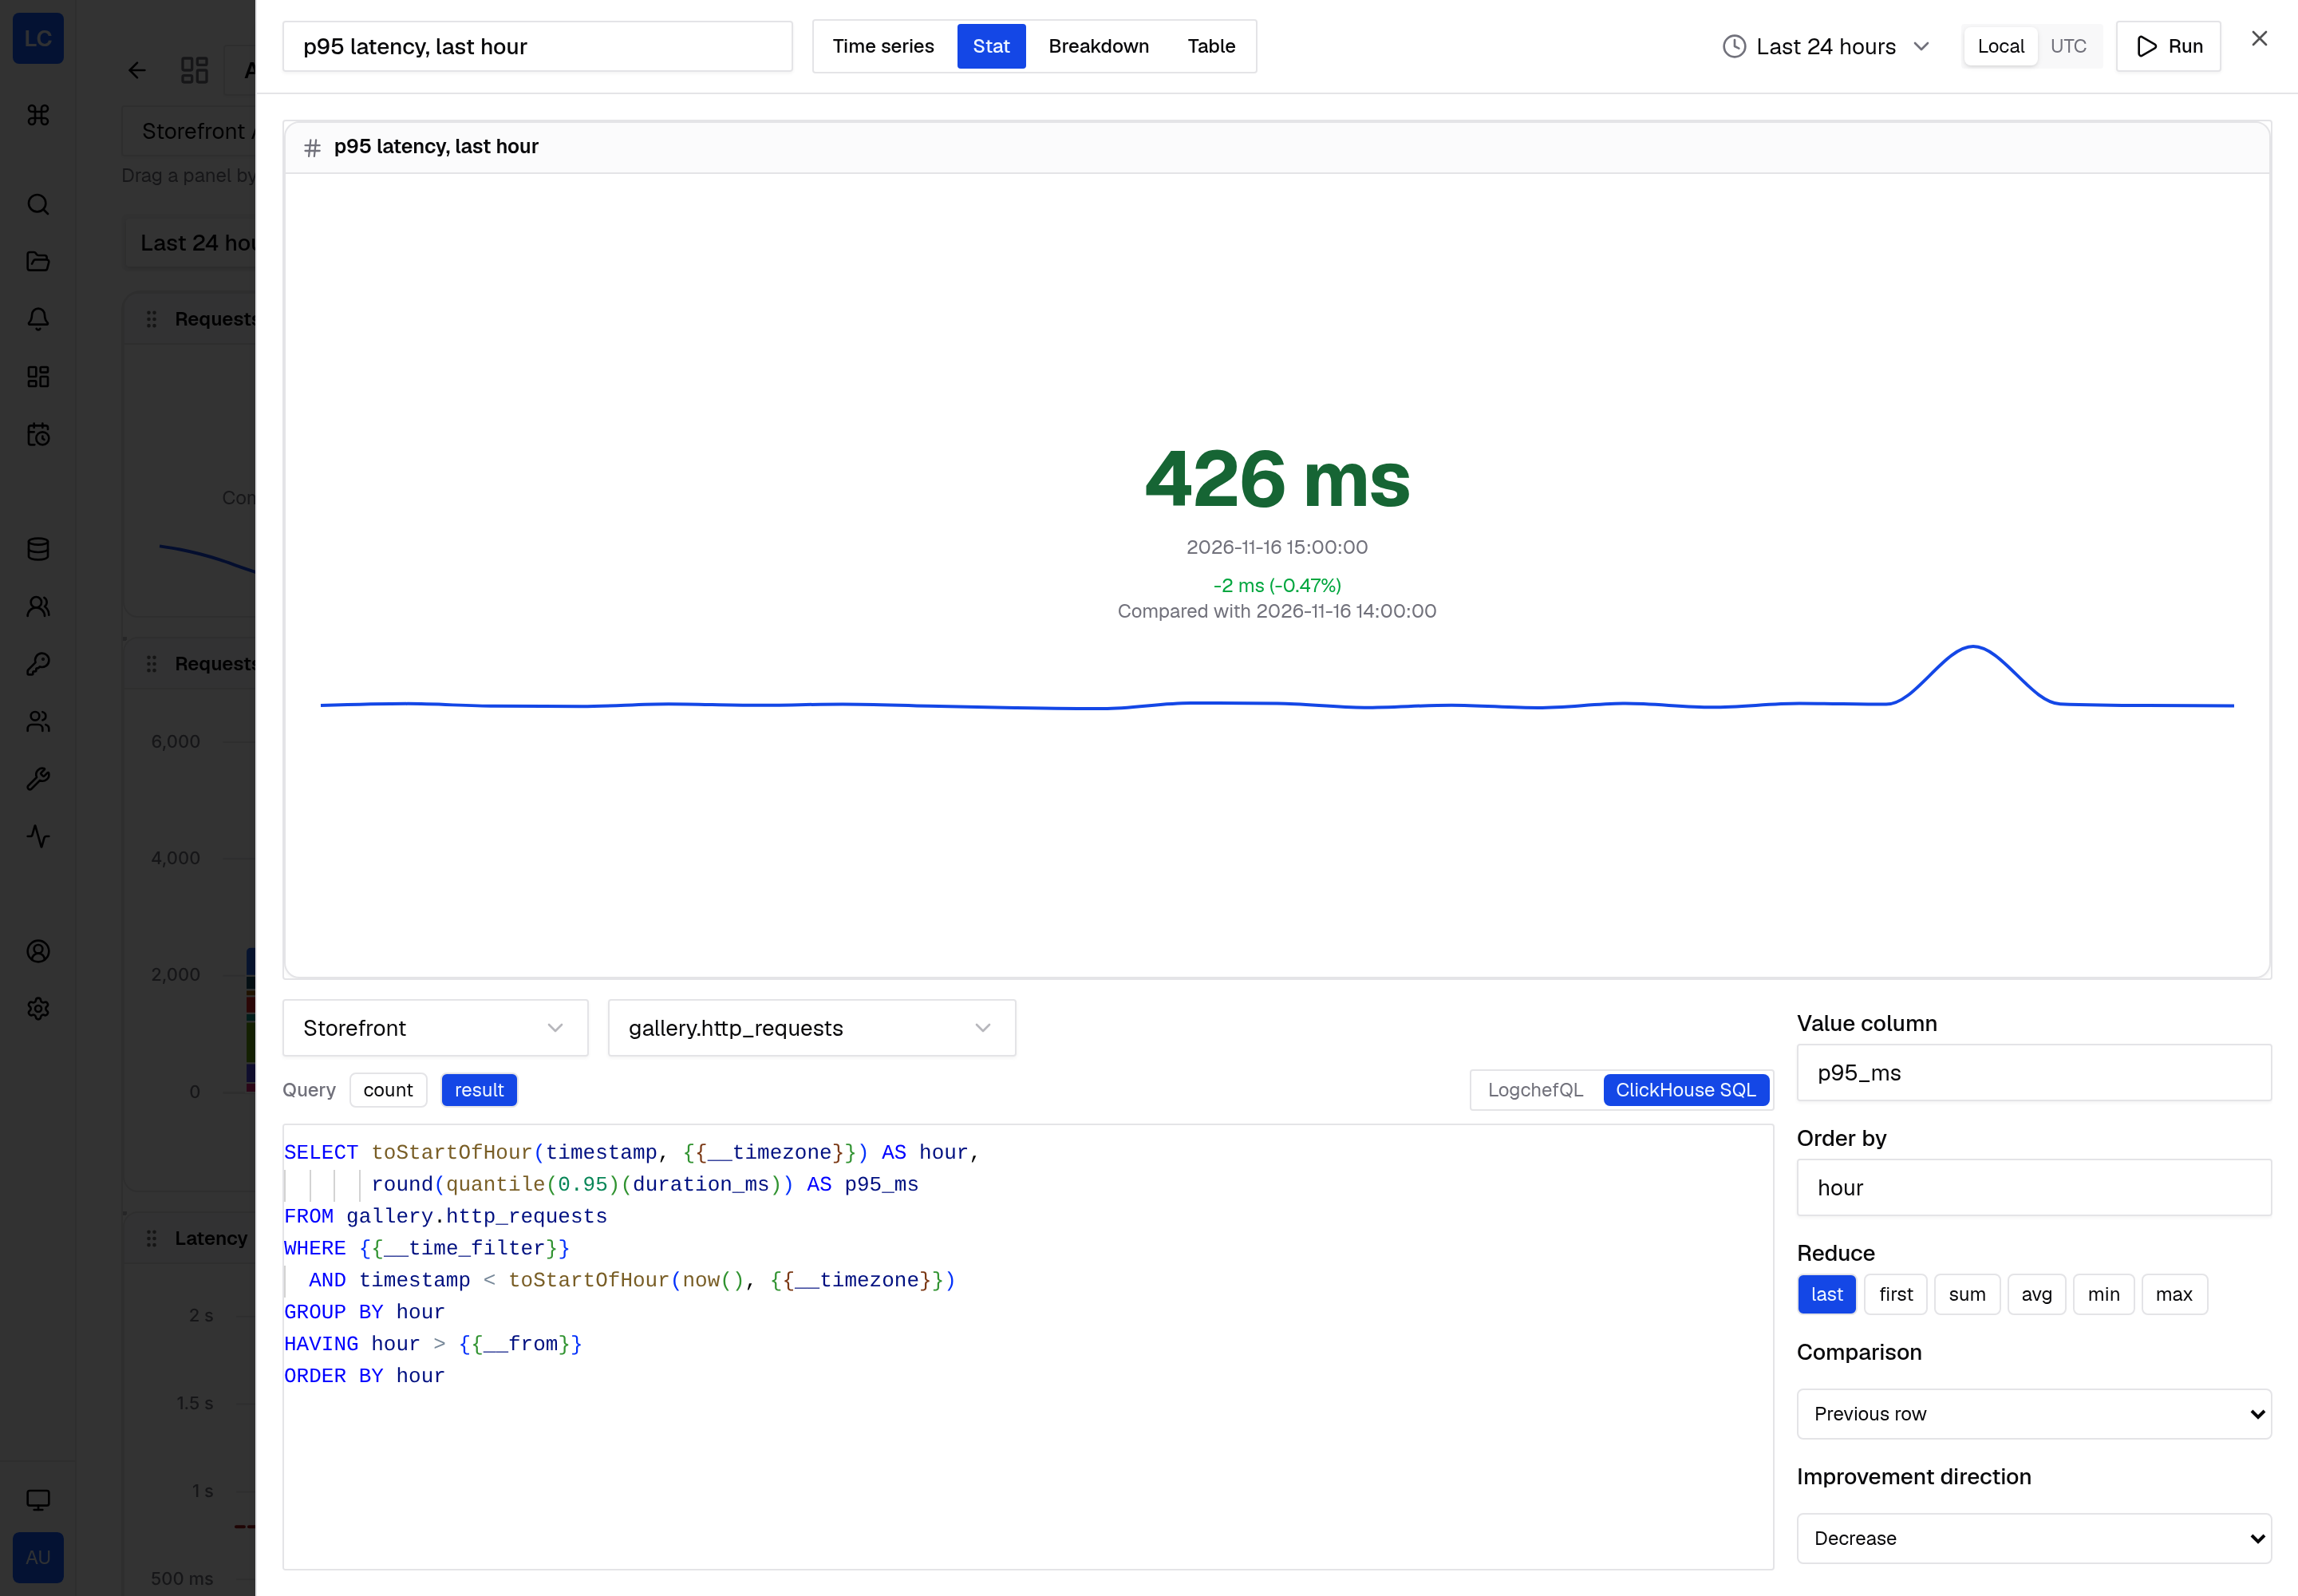
For a stat, the same column sets the value column, Order by, the reducer, the comparison and its improvement direction, and the sparkline.
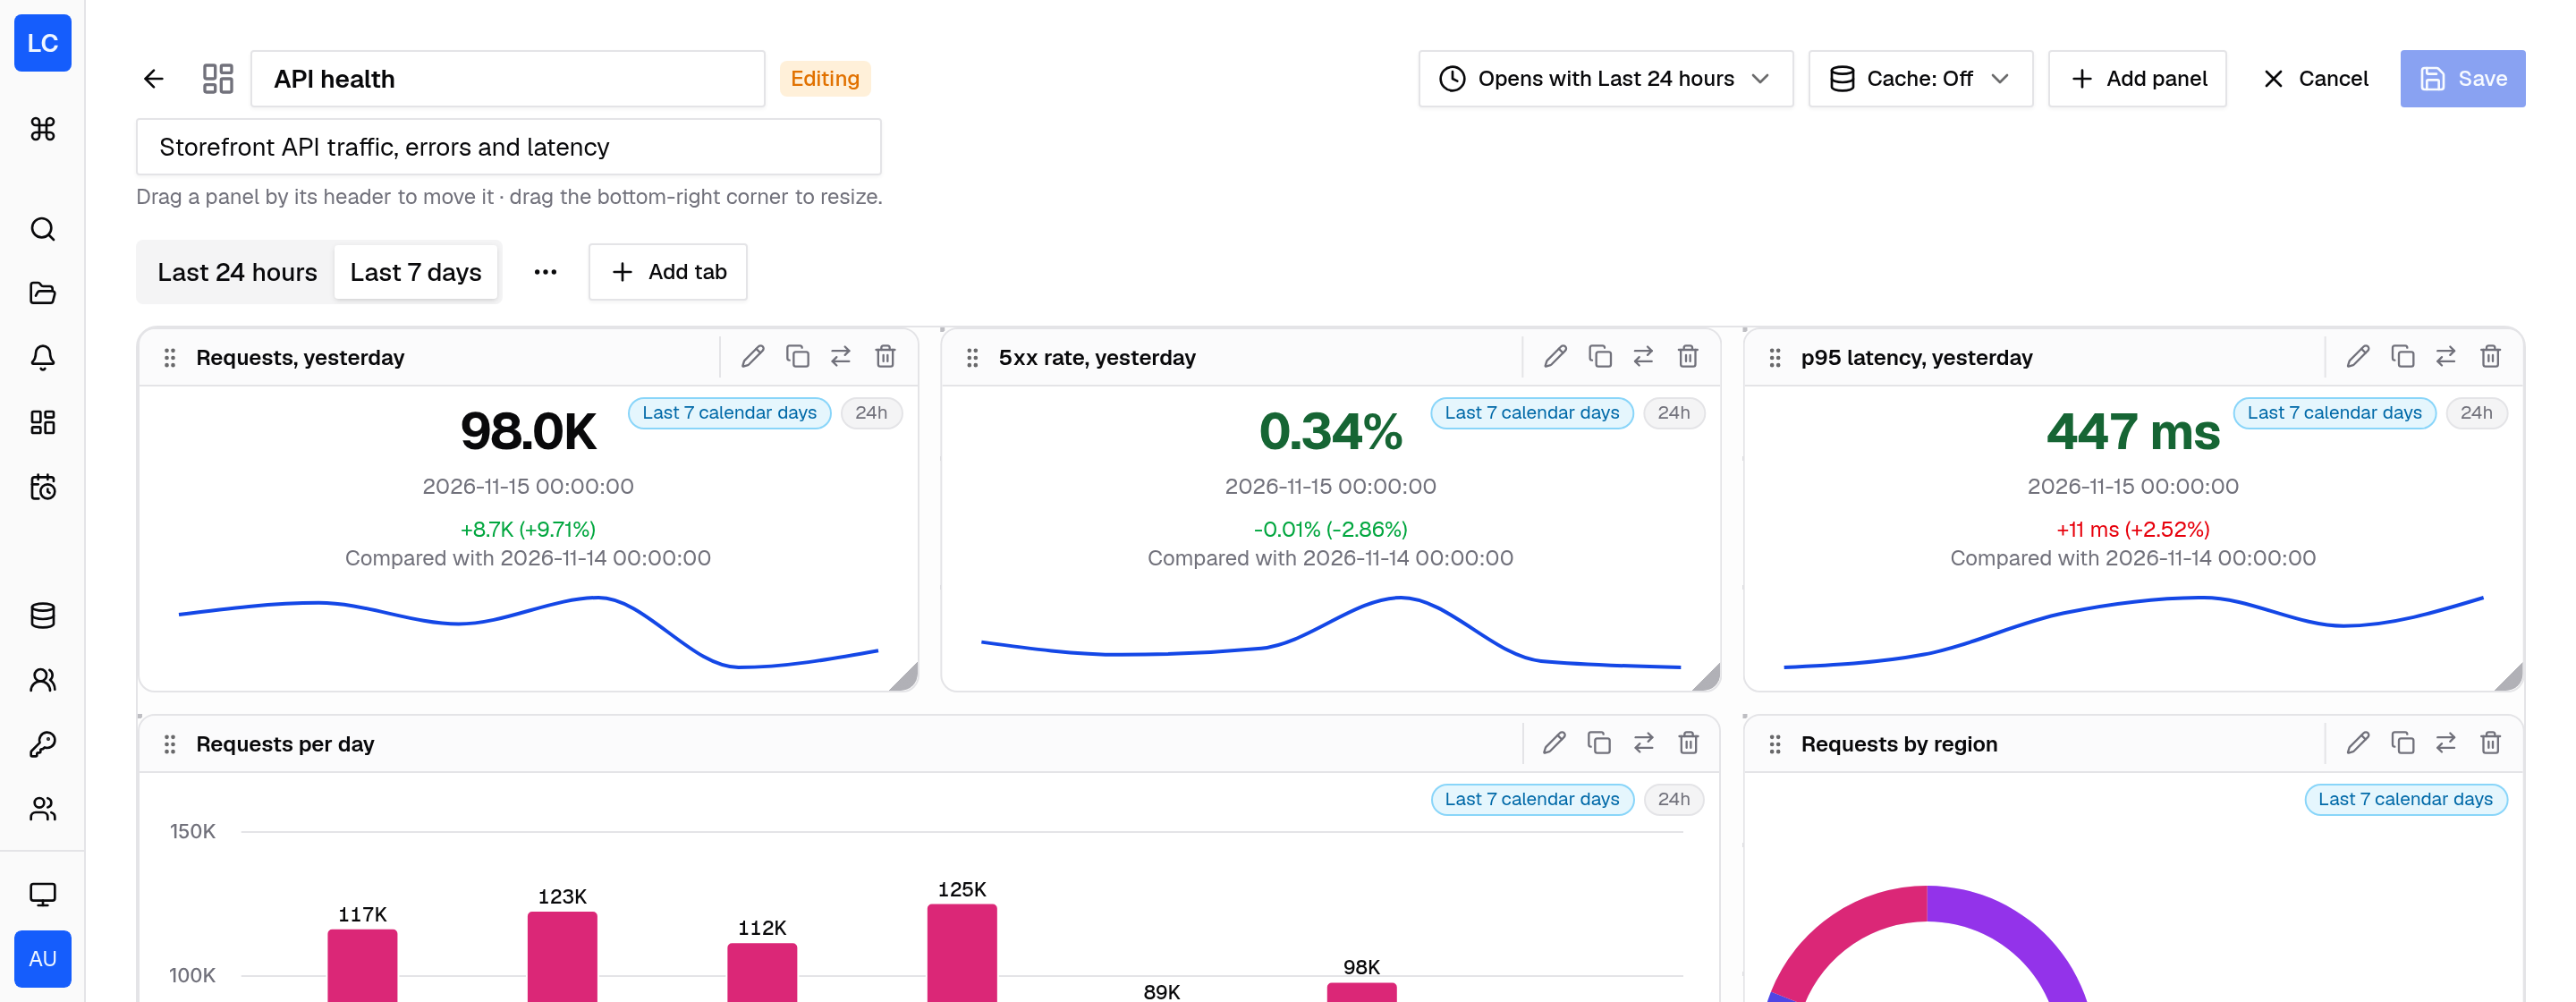
In edit mode the tab bar gets a menu to rename, move or delete the open tab, and Add tab next to it. The toolbar sets the range the dashboard opens with and its cache TTL.
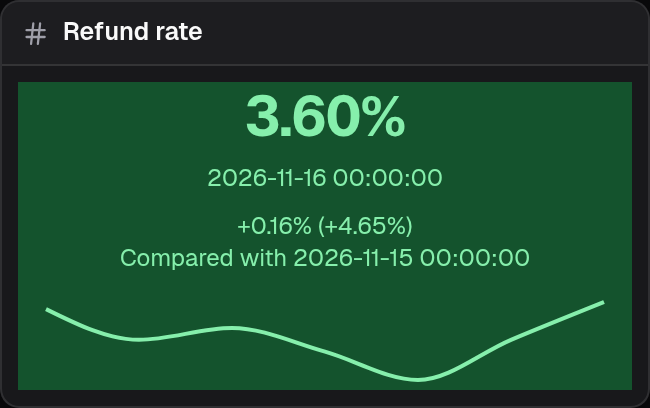
A stat with a background threshold keeps the comparison and the sparkline on the colored background.