You already have the query. It’s saved in a Logchef collection, it finds 5xx responses by service, and the on-call engineer runs it a few times a day. Now someone wants it on the wall screen next to the team: a count per service over the last 24 hours, the p95 latency, and the last twenty failed requests.
Until now that meant a second tool. Install Grafana, add the ClickHouse plugin, create another set of database credentials, rewrite the query in the plugin’s dialect, and work out who should see which panel, since Grafana knows nothing about the team and source permissions you set up in Logchef. Two places to keep queries, two access models to keep in step, and one more service to upgrade.
Logchef has dashboards built in. A dashboard is a grid of panels. Each panel is a query rendered as a chart, a number, a breakdown or a table, and all of them share one time range and refresh together. They live in the same metadata store as your teams, sources and saved queries, so there is nothing to enable in config and no extra process to run.
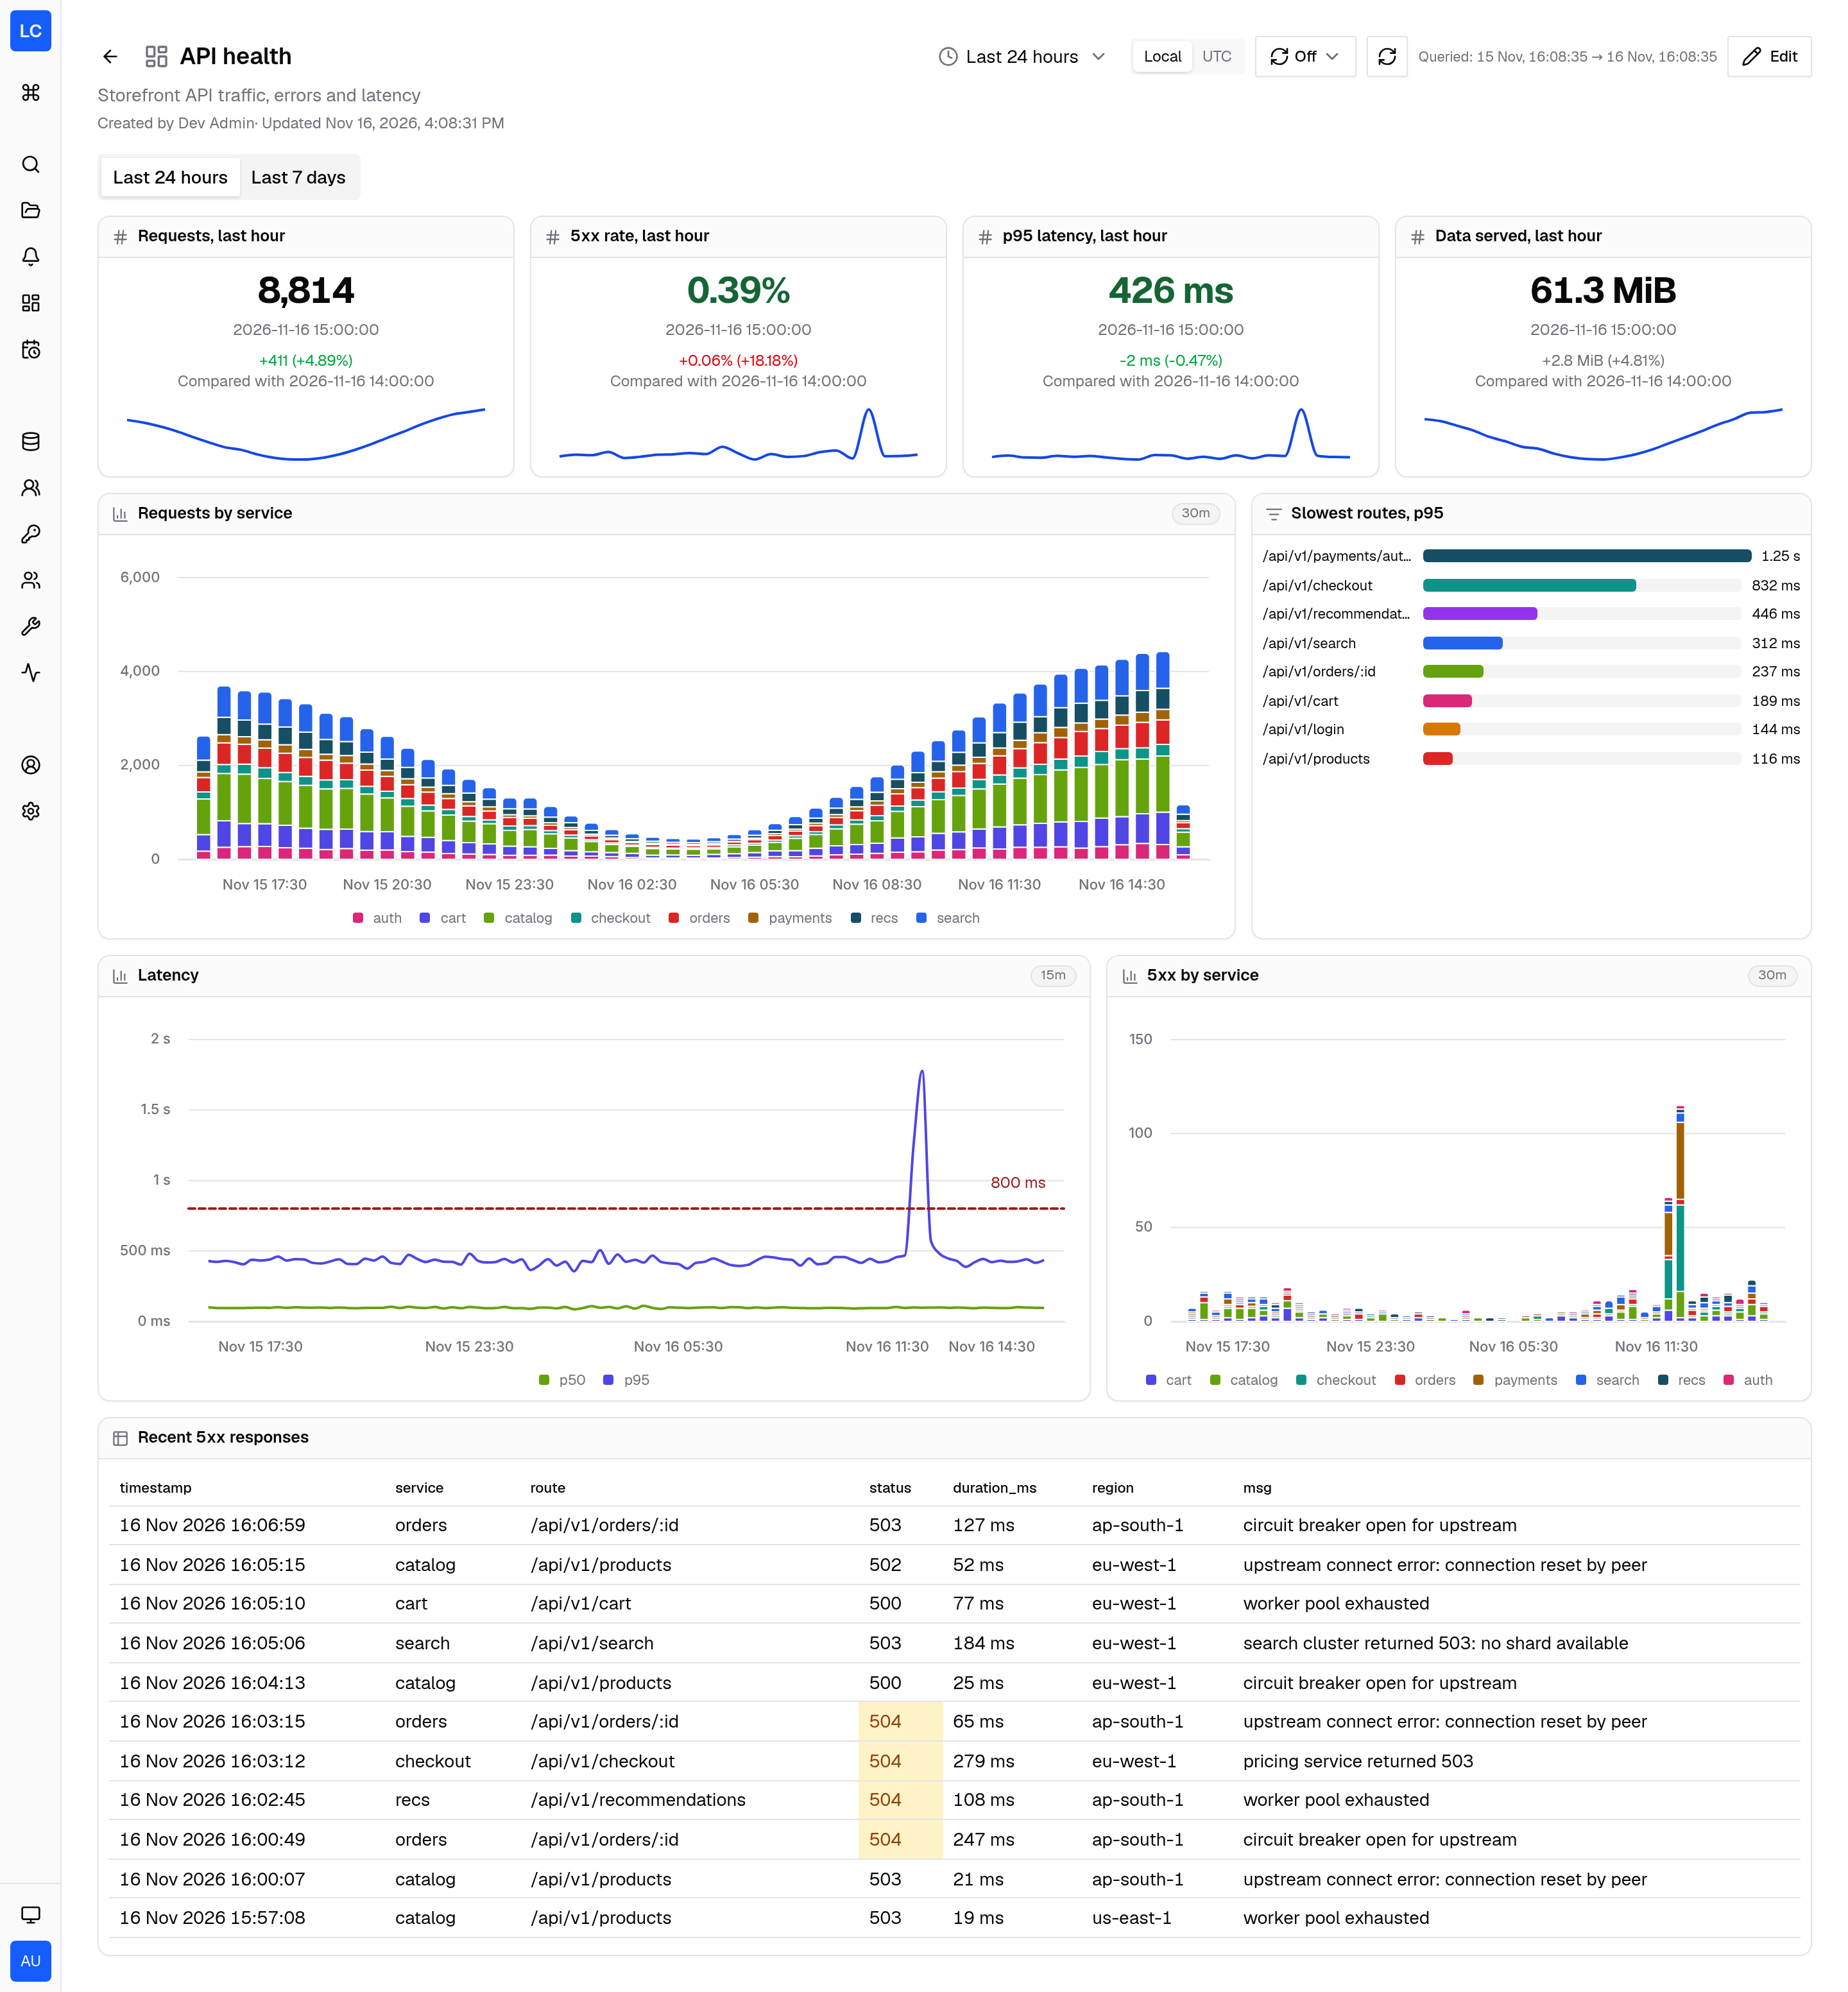
Four panel types
Every panel picks its own team, source and query language (LogchefQL, ClickHouse SQL, LogsQL for a VictoriaLogs source, or LogQL for a Grafana Loki source), and renders as one of:
- Time series: a line, area or bar chart. Bars can be stacked or grouped.
- Stat: one value, reduced from a result column with
last,first,sum,avg,minormax. - Breakdown: horizontal bars (a toplist) or a donut.
- Table: the matching rows, with a row limit and a column subset.
Panels run in one of two modes. Count mode uses the same histogram endpoint as the explorer, so a filter like level="error" grouped by service becomes a stacked chart with no SQL at all. Result mode runs the query as written, aggregates included, and you pick which columns are X, Y and series, or label and value.
Start from a query you already have
The quickest path starts in the explorer. Run a LogchefQL aggregation, click Add to dashboard, and choose a dashboard you can edit:
service=api | p95(duration_ms) by time, serviceThe builder reads the result columns and suggests roles: time becomes X, the value becomes Y, and service becomes the series. A bare time key follows the panel’s bucket size, so the chart rescales when you change the time picker. Empty buckets are filled with 0 for count and left as gaps for other functions, so a quiet hour doesn’t look like a latency drop to zero.
For anything LogchefQL doesn’t express, write SQL. A ClickHouse SQL panel follows the time picker when it uses the time macros:
SELECT count() AS n FROM default.http WHERE {{__time_filter}}A SQL panel without the macros keeps the window its own WHERE clause sets, and its header shows a Fixed window chip so nobody mistakes it for the picker’s range.
Stats that answer “compared with what”
A bare number on a wall screen invites the next question: is that more than usual? A stat panel can compare its value with the previous row and draw a sparkline under it. This query from the dashboard gallery returns one row per whole hour of p95 latency:
SELECT toStartOfHour(timestamp, {{__timezone}}) AS hour, round(quantile(0.95)(duration_ms)) AS p95_msFROM gallery.http_requestsWHERE {{__time_filter}} AND timestamp < toStartOfHour(now(), {{__timezone}})GROUP BY hourHAVING hour > {{__from}}ORDER BY hourPick p95_ms as the value, hour as Order by, the last reducer, Previous row as the comparison and Decrease as the improvement direction. The tile shows the last full hour, the change from the hour before as a delta and a percentage, and colors it green or red by which way counts as better. The comparison is with the neighboring row, not a calendar period, so if you want “today versus yesterday”, return one row per day.
Stats and charts also take up to ten threshold steps. A stat colors its value or background by step, and a chart draws a labeled reference line for each one, such as the 800 ms line on the latency chart above. Tables take up to twenty rules that highlight a cell or a whole row: a 504 status, a message that contains “timed out”, an empty value.
Number formats cover scale, decimals, prefix and suffix, so 52,900,000 can read as ₹5.29 Cr.
Tabs and per-panel time
One dashboard often needs two views of time. The API health example opens on the last 24 hours, and its second tab answers “how does this week look”.
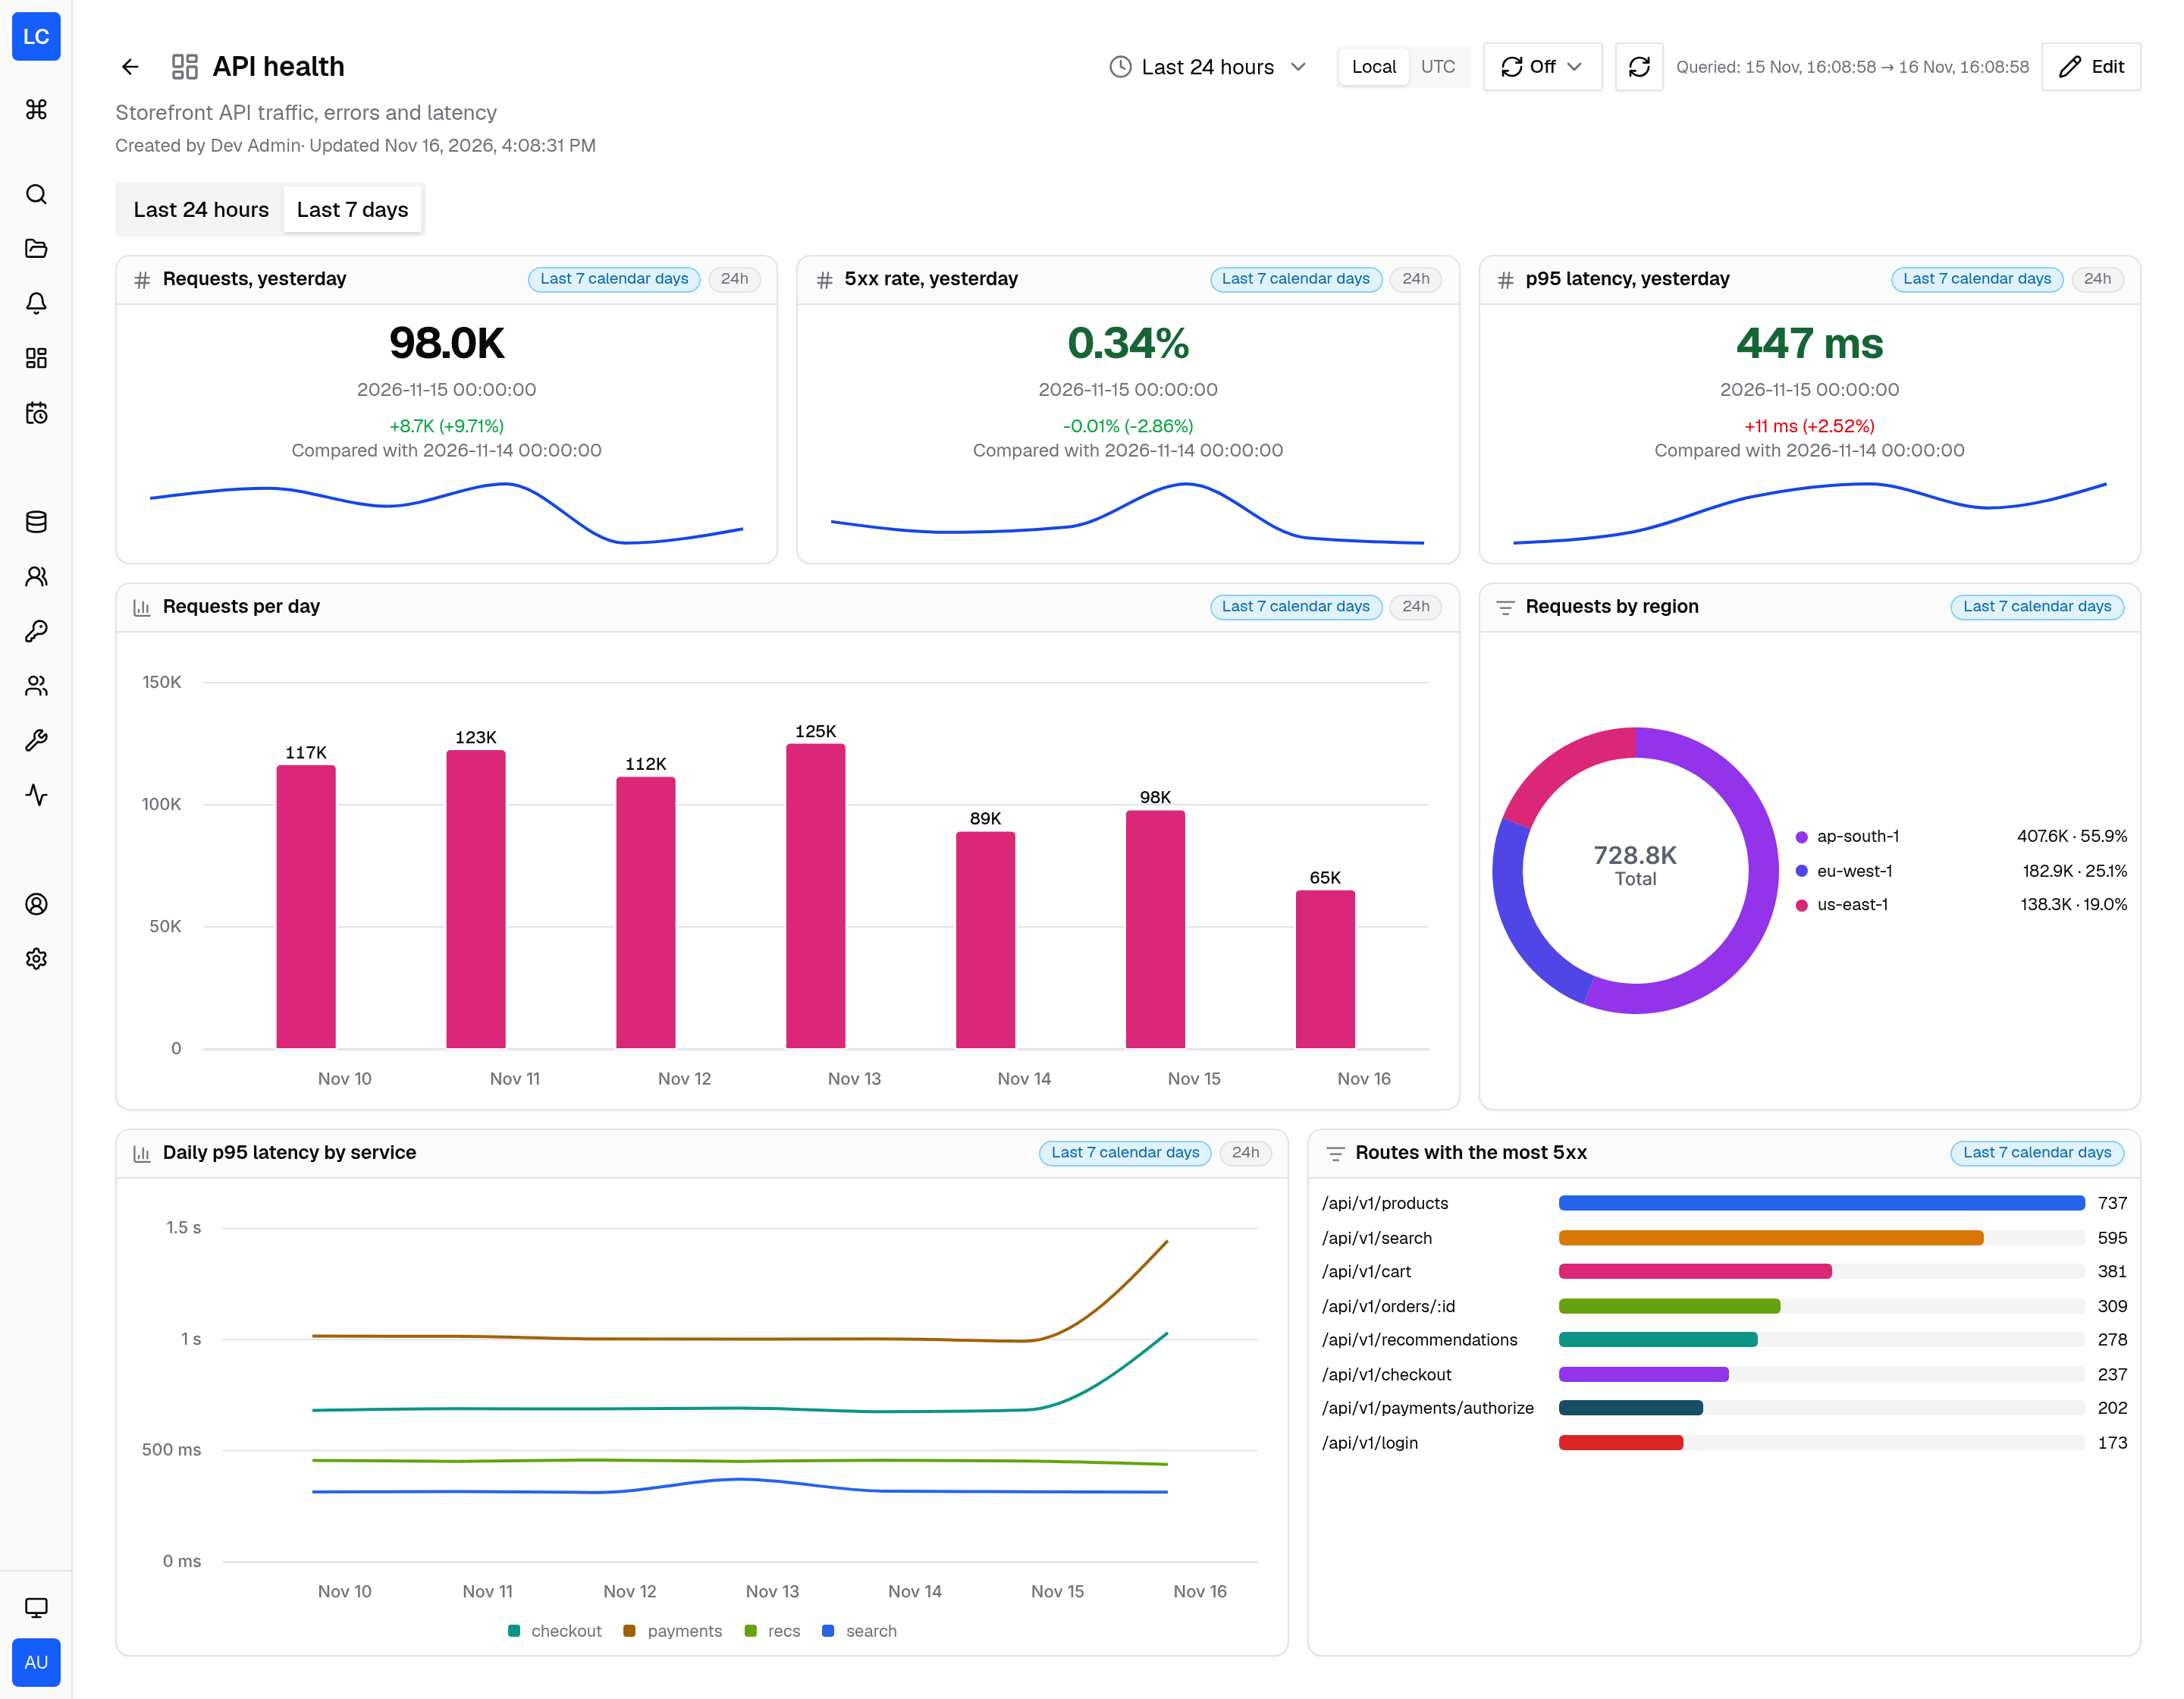
A dashboard can hold up to 10 tabs. Only the tab on screen runs its queries, so a heavy weekly tab costs nothing until someone opens it, and the open tab is part of the URL, so a shared link lands on the same view.
Any panel can pin its own range and bucket size. On that weekly tab each panel sets the calendar range today-6d (today and the six days before it in the viewer’s timezone) with 24h buckets, so each bar is one calendar day. Chips in the panel header show which range and bucket size actually ran. If a fixed bucket size would produce more than 1,000 buckets, Logchef raises it to the next size that fits and the chip turns amber to say so.
ClickHouse, VictoriaLogs and Loki on one dashboard
Because each panel picks its own source, one dashboard can put a ClickHouse time series next to a VictoriaLogs stat or a Grafana Loki table. LogchefQL compiles to SQL, LogsQL or LogQL depending on the panel’s source, and you can switch a single VictoriaLogs panel to native LogsQL:
level:error | stats by (service) count() as errors | sort by (errors desc)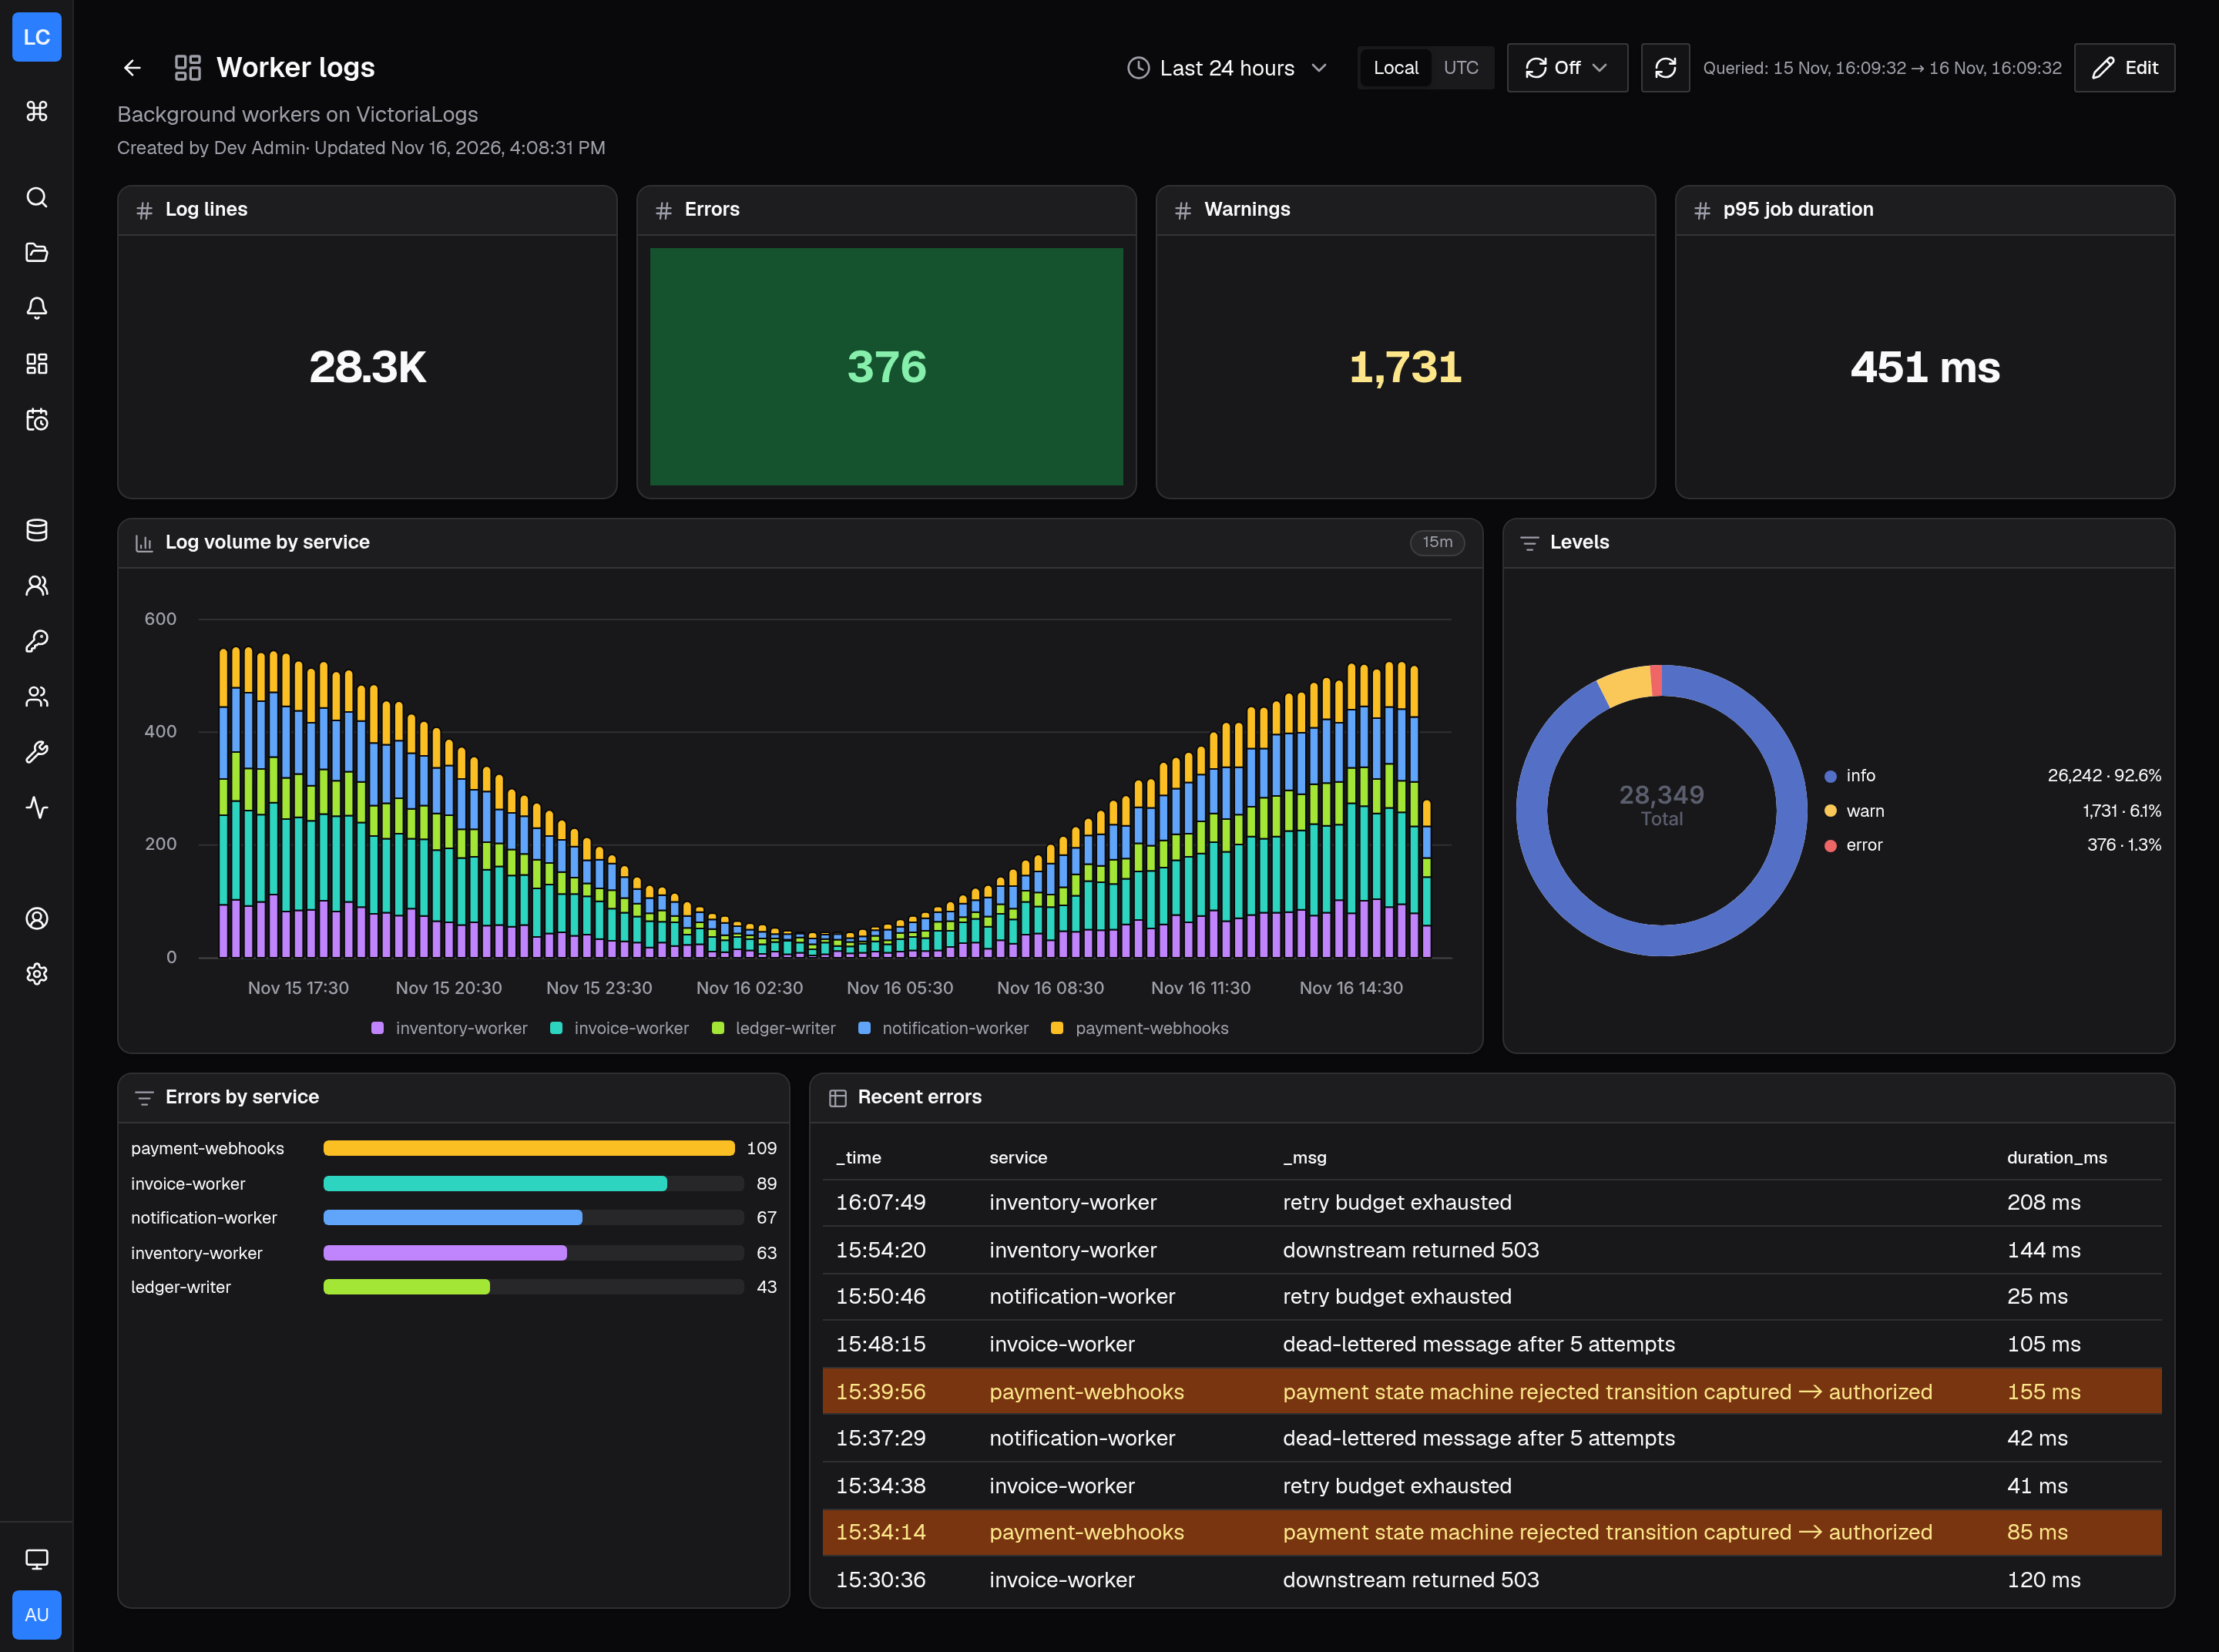
VictoriaLogs returns every field as text, so you confirm column kinds in the builder (duration_ms is a number, _time is a time). ClickHouse types are read directly.
A Loki panel takes LogchefQL or native LogQL. In result mode, a LogQL metric query returns value, time and one column per label, so it charts like any other result:
sum by (level) (count_over_time({service_name=~".+"} [{{__interval}}])){{__interval}} follows the panel’s bucket size. LogchefQL aggregation pipes don’t run on Loki, so write the metric query in LogQL. The Grafana Loki tutorial covers Loki panels.
Access and load
Panels run through the same team-scoped query endpoints the explorer uses. A dashboard adds no new path to log data: if a viewer can’t query a panel’s source in the explorer, that panel shows a locked state and the rest of the dashboard loads normally.
Auto-refresh (30 seconds, 1 minute or 5 minutes) makes a wall screen useful and expensive: N panels open by M viewers is up to N×M queries per cycle. Each dashboard has a cache TTL, 10 minutes by default, backed by a shared server-side cache. The first viewer fills it and everyone else in that window gets the stored result. Set the TTL to 0 to always query live. Explorer queries are never cached.
Editing is a drag-and-drop grid with a panel builder that shows a live preview. The creator and global admins can edit a dashboard, and so can a team owner, admin or editor of every team its query panels use. If a teammate saves the same dashboard while you edit it, Logchef asks whether to save yours as a copy, overwrite theirs, or load the latest.
When nobody is watching the screen, Schedule report in the dashboard toolbar emails a dashboard, or one tab of it, on an hourly, daily, weekly or monthly schedule. See scheduled reports for how each panel type renders in the email.
What this doesn’t do
Some limits, so you can decide whether this replaces Grafana for you or sits next to it:
- Panels query ClickHouse, VictoriaLogs and Grafana Loki log sources. There is no Prometheus or other metrics data source. Logchef’s own Prometheus metrics still need a metrics tool, and the repo ships a Grafana dashboard for exactly that.
- A dashboard holds up to 24 panels across its tabs.
- There are no per-dashboard sharing roles yet. The creator, global admins and members of the teams a dashboard’s panels use can view it, and only the creator or a global admin can delete it. Source access is still enforced on every panel query.
- Grouped histograms return the top 10 series and fold the rest into other. Group by service, host or severity, not request IDs.
- On VictoriaLogs, day-sized count buckets use one fixed UTC offset, so a range that crosses a daylight-saving change shows a notice. ClickHouse panels follow the change.
Try it
Dashboards need no configuration. Tabs, stat comparisons, thresholds, table rules and per-panel ranges shipped in v2.7.0. Loki panels, charting LogchefQL aggregations from Add to dashboard, team editing and emailing dashboards as scheduled reports shipped in v2.8.0. The dashboard docs cover every panel option, and the gallery has three example dashboards with copyable queries. The scripts that build its data and dashboards are in dev/gallery. Source, issues and the Docker quick-start are at github.com/mr-karan/logchef.