This is the full developer documentation for Logchef
# Documentation
> Logchef is a fast, lightweight log analytics platform for ClickHouse and VictoriaLogs. Browse setup, configuration, and usage guides.
This is the Logchef documentation. Start with the guides below.
[Quick Start](/getting-started/quickstart)Get Logchef running in under 5 minutes
[Architecture](/core/architecture)Understand how Logchef works
[Configuration](/getting-started/configuration)Configure Logchef for your environment
[Query Interface](/user-guide/query-interface)Learn how to search and analyze your logs
## Popular Topics
[Section titled “Popular Topics”](#popular-topics)
* [Using VictoriaLogs with Logchef](/tutorials/victorialogs): connect a VictoriaLogs datasource
* [Dashboards](/features/dashboards): multi-panel views with a shared time range
* [AI SQL Generation](/features/ai-sql-generation): ask questions in plain English
* [Field Sidebar](/features/field-sidebar): visual field discovery and filtering
* [Alerting](/features/alerting): set up real-time log alerts
* [CLI](/integration/cli): query logs from your terminal
* [MCP Server](/integration/mcp-server): integrate with Claude and other AI assistants
# Comparisons
> Honest comparisons between Logchef and other log analytics and observability tools, covering architecture, features, and when to choose each.
Logchef is a query and control-plane UI over ClickHouse or VictoriaLogs data you already have — it doesn’t collect logs or own a schema. That makes it a good fit for some teams and the wrong tool for others. These pages compare Logchef against adjacent projects on architecture and features, and try to be direct about where another tool is the better choice.
* [Logchef vs ClickStack](/comparisons/logchef-vs-clickstack/) — how Logchef’s schema-agnostic log UI compares to ClickStack (HyperDX), ClickHouse’s end-to-end observability stack covering logs, traces, metrics, and session replay.
* [Logchef vs Grafana Loki](/comparisons/logchef-vs-grafana-loki/) — how Logchef’s ClickHouse/VictoriaLogs-backed search compares to Loki’s label-indexed, object-storage logging, why high-cardinality fields behave differently, and how Logchef + VictoriaLogs is itself a Loki alternative.
# Logchef vs ClickStack
> How Logchef's query UI over existing ClickHouse/VictoriaLogs data compares to ClickStack (HyperDX), ClickHouse's full OpenTelemetry observability stack.
Both projects put ClickHouse’s speed in front of engineers looking at logs, but they start from different premises and solve different problems. This page compares them honestly so you can pick the right tool — including picking ClickStack, if that’s the better fit.
## The short version
[Section titled “The short version”](#the-short-version)
**Logchef** is a query and control-plane UI you point at ClickHouse tables or VictoriaLogs instances you already have. It doesn’t collect logs, doesn’t require a particular schema, and doesn’t try to be an APM. It’s a fast, single binary front end for log search, dashboards, alerting, and team access control over data your existing pipeline already writes.
**ClickStack** (built by ClickHouse, formerly known as HyperDX) is an opinionated, end-to-end observability platform: an OpenTelemetry Collector, ClickHouse, and the HyperDX UI shipped together, covering logs, traces, metrics, and session replay. It owns the ingestion pipeline and is built around an OpenTelemetry-shaped schema.
If you already ship logs into ClickHouse or VictoriaLogs with Vector, Filebeat, Fluent Bit, or your own OTel pipeline, and you want a lightweight UI on top without adopting a new schema, Logchef fits that gap. If you’re starting from scratch and want logs, traces, metrics, and session replay correlated in one product with an ingestion pipeline included, ClickStack is the more complete answer, see [When ClickStack is the better choice](#when-clickstack-is-the-better-choice) below.
## What each project actually is
[Section titled “What each project actually is”](#what-each-project-actually-is)
### Logchef
[Section titled “Logchef”](#logchef)
Logchef is a specialized query and visualization layer that sits in front of log storage you control. Per its own [architecture documentation](/core/architecture/), it intentionally excludes any ingestion pipeline: collectors like Vector or Filebeat write logs into ClickHouse or VictoriaLogs, and Logchef only reads them back out. Beyond a timestamp column, it does not require a specific [table schema](/integration/schema-design/) — it ships an optional, tuned OpenTelemetry-style schema, but works against any existing ClickHouse table or VictoriaLogs source.
* **Backends**: ClickHouse and VictoriaLogs, chosen per source
* **Query languages**: LogchefQL (Logchef’s own filter syntax), plus each backend’s native language (ClickHouse SQL or VictoriaLogs LogsQL)
* **Signals**: logs. ClickHouse-backed sources can carry `trace_id`/`span_id` columns for correlation, but Logchef has no trace waterfall, APM, or session-replay UI
* **Deployment**: single Go binary, SQLite metadata store by default, optional Postgres for [multi-replica HA](/operations/database-backends/)
* **Access control**: OIDC/SSO or built-in local auth, [team-scoped source access](/core/user-management/)
* **Alerting**: [scheduled query evaluation](/features/alerting/) with email/webhook notifications
* **Dashboards**: [multi-panel grid](/features/dashboards/) (time series/stat/table) that can mix ClickHouse and VictoriaLogs panels
* **AI**: optional [natural-language-to-SQL assistant](/features/ai-sql-generation/) against any OpenAI-compatible API, plus an [MCP server](/integration/mcp-server/) for AI coding assistants
* **License**: AGPLv3
* **Latest version referenced here**: v1.7.0 (2026-07-06)
### ClickStack
[Section titled “ClickStack”](#clickstack)
ClickStack is ClickHouse’s own observability stack, built around the HyperDX project ClickHouse acquired and now ships as “ClickStack.” Its documentation describes three components shipped together: ClickHouse (the datastore), an OpenTelemetry Collector (ingestion), and HyperDX (the UI for search, dashboards, alerts, and session replay). It’s explicitly OpenTelemetry-native — the bundled collector is the primary ingestion path — though ClickHouse’s docs note the schema isn’t strictly limited to OTel, as long as events carry a timestamp.
* **Backend**: ClickHouse (the stack doesn’t support VictoriaLogs or other datastores)
* **Query languages**: a Lucene-style search syntax in the UI (transpiled to SQL), plus direct SQL for advanced queries
* **Signals**: logs, traces, metrics, session replay, and exceptions/errors — a full observability surface, not logs-only
* **Ingestion**: owns the pipeline via a bundled OpenTelemetry Collector; instrumented with OTel SDKs (JS, Python, Java, Go, Ruby, PHP, .NET, Elixir, Rust) or HyperDX’s own browser/Node/Python SDKs
* **Deployment**: a single all-in-one Docker container for local/small setups, Docker Compose for multi-container deployments, or Kubernetes/Helm; the self-hosted open-source stack also runs a MongoDB instance to store application state (dashboards, alerts, saved searches, user profiles) — something Logchef doesn’t need, since that metadata lives in Logchef’s own SQLite/Postgres store instead
* **Managed option**: “Managed ClickStack” on ClickHouse Cloud, which takes over storage/compute scaling, backups, and (per ClickHouse’s docs) fine-grained RBAC as part of the managed/enterprise tier — the self-hosted OSS docs don’t detail an equivalent RBAC model
* **License**: HyperDX UI is MIT-licensed; ClickHouse and the OpenTelemetry Collector are Apache 2.0
* **Latest version referenced here**: HyperDX/ClickStack app v2.30.1 (published 2026-07-13)
## Feature comparison
[Section titled “Feature comparison”](#feature-comparison)
*Last updated 2026-07-14. Versions compared: Logchef v1.7.0, ClickStack (HyperDX app) v2.30.1. Both projects move fast — verify current behavior against each project’s own docs before making a decision.*
| | Logchef | ClickStack |
| --------------------------- | ------------------------------------------------------------------------------------------------------ | ------------------------------------------------------------------------------------------------------------------ |
| Backend(s) | ClickHouse, VictoriaLogs | ClickHouse only |
| Owns ingestion? | No — reads existing data | Yes — bundled OTel Collector |
| Forced schema? | No (timestamp column only; optional tuned schema available) | OTel-shaped by default; other formats work if a timestamp is present |
| Logs | Yes | Yes |
| Traces | No (ClickHouse sources can store `trace_id`/`span_id` for correlation, no trace UI) | Yes, native waterfall/APM view |
| Metrics | No | Yes |
| Session replay | No | Yes |
| Query languages | LogchefQL, ClickHouse SQL, VictoriaLogs LogsQL | Lucene-style search, SQL |
| Alerting | Scheduled query evaluation, email/webhook | Built into HyperDX UI |
| Dashboards | Multi-panel grid, mixed backends per dashboard | Built into HyperDX UI |
| Saved queries / collections | Yes, team-shared [Collections](/features/collections/) | Saved searches (per HyperDX UI) |
| RBAC | Team-based, OIDC/SSO or local auth | Not detailed for self-hosted OSS; fine-grained RBAC positioned as a managed/enterprise feature |
| HA / multi-replica | Optional Postgres metadata backend for multi-replica ([caveats apply](/operations/database-backends/)) | Managed ClickStack (ClickHouse Cloud) handles HA/scaling; self-hosted HA is on you via ClickHouse’s own clustering |
| Deployment footprint | Single binary + your existing ClickHouse/VictoriaLogs | ClickHouse + OTel Collector + HyperDX UI (+ MongoDB for self-hosted app state) |
| AI features | NL-to-SQL assistant, MCP server for coding assistants | Not part of core OSS docs reviewed here |
| License | AGPLv3 | HyperDX UI: MIT. ClickHouse, OTel Collector: Apache 2.0 |
## When Logchef is the better choice
[Section titled “When Logchef is the better choice”](#when-logchef-is-the-better-choice)
* You already ship logs into ClickHouse or VictoriaLogs (Vector, Fluent Bit, Filebeat, a custom pipeline) and don’t want to re-architect ingestion or adopt a new schema to get a good UI.
* You want a single static binary with no additional services beyond the datastore you already run.
* Your problem is genuinely logs-first: search, saved queries shared across a team, scheduled alerts, and simple multi-panel dashboards — not full APM, traces, or session replay.
* You need VictoriaLogs support specifically, or want to mix ClickHouse and VictoriaLogs sources under one access-control model.
* You want team-scoped RBAC and OIDC/SSO out of the box without an enterprise tier.
## When ClickStack is the better choice
[Section titled “When ClickStack is the better choice”](#when-clickstack-is-the-better-choice)
* You’re instrumenting a system from scratch and want logs, traces, metrics, and session replay correlated in one product, with the ingestion pipeline included rather than assembled separately.
* You need real APM: trace waterfalls, span-level latency breakdowns, exception tracking tied to user sessions.
* You’d rather adopt OpenTelemetry as your instrumentation standard than bring an existing, possibly non-OTel, log schema.
* You want a managed option (ClickHouse Cloud’s Managed ClickStack) that takes ingestion, storage scaling, and backups off your plate.
## They can coexist
[Section titled “They can coexist”](#they-can-coexist)
Because Logchef doesn’t own ingestion or a schema, it can point at the same ClickHouse tables ClickStack’s OpenTelemetry Collector writes into — nothing about the two is mutually exclusive. Some teams use ClickStack’s collector for ingestion and traces/metrics, and use Logchef as a lighter, team-scoped UI for day-to-day log search and alerting on top of the resulting tables. If you go this route, start from [Logchef’s schema design guide](/integration/schema-design/) to confirm your OTel table layout works well with LogchefQL.
## Further reading
[Section titled “Further reading”](#further-reading)
* [Logchef architecture](/core/architecture/)
* [Choosing between ClickHouse and VictoriaLogs sources](/integration/schema-design/)
* [Database backends and HA](/operations/database-backends/)
* [Alerting](/features/alerting/)
* [Dashboards](/features/dashboards/)
* ClickStack: [clickhouse.com/clickstack](https://clickhouse.com/clickstack)
* HyperDX on GitHub: [github.com/hyperdxio/hyperdx](https://github.com/hyperdxio/hyperdx)
# Logchef vs Grafana Loki
> How Logchef over ClickHouse or VictoriaLogs compares to Grafana Loki: indexing model, high-cardinality search, query languages, and when each fits.
Both let you search logs without paying for a hosted SaaS, but they take opposite approaches to storage and indexing, and they slot into very different stacks. This page compares them honestly so you can pick the right tool — including picking Loki, if that’s the better fit.
## The short version
[Section titled “The short version”](#the-short-version)
**Logchef** is a query and control-plane UI you point at ClickHouse tables or VictoriaLogs instances you already run. It doesn’t collect logs and doesn’t force a schema — collectors write logs into your backend, and Logchef reads them back out with fast full-text search, SQL, dashboards, alerting, and team access control.
**Grafana Loki** is a full logging backend: it ingests logs through agents (Promtail / Grafana Alloy), indexes only a small set of *labels* (not the log content), stores compressed chunks in object storage (S3/GCS/local), and is queried with LogQL — almost always through Grafana’s UI. It’s the “L” in Grafana’s LGTM stack.
If you already run — or want to run — ClickHouse or VictoriaLogs and need fast search over high-cardinality fields plus SQL analytics, Logchef fits that gap. If you want the cheapest possible object-storage logging at large scale, with low-cardinality labels, inside a Grafana-centric stack, Loki is the more natural answer — see [When Grafana Loki is the better choice](#when-grafana-loki-is-the-better-choice).
## What each project actually is
[Section titled “What each project actually is”](#what-each-project-actually-is)
### Logchef
[Section titled “Logchef”](#logchef)
Logchef is a query and visualization layer that sits in front of log storage you control. Per its [architecture documentation](/core/architecture/), it intentionally excludes any ingestion pipeline: collectors like Vector, Fluent Bit, or an OpenTelemetry pipeline write logs into ClickHouse or VictoriaLogs, and Logchef only reads them back. Beyond a timestamp column it doesn’t require a specific [table schema](/integration/schema-design/).
* **Backends**: ClickHouse and VictoriaLogs, chosen per source
* **Indexing**: whatever the backend does — ClickHouse indexes columns (including high-cardinality ones) and supports full-text via tokenized indexes; VictoriaLogs indexes all fields
* **Query languages**: LogchefQL (Logchef’s own filter syntax), plus each backend’s native language (ClickHouse SQL or VictoriaLogs LogsQL)
* **Signals**: logs (ClickHouse sources can carry `trace_id`/`span_id` columns for correlation; there is no trace/APM UI)
* **Deployment**: single Go binary, SQLite metadata by default, optional Postgres for [multi-replica HA](/operations/database-backends/)
* **UI**: its own [explorer](/), [dashboards](/features/dashboards/), [alerting](/features/alerting/), and [access control](/core/user-management/)
* **License**: AGPLv3
### Grafana Loki
[Section titled “Grafana Loki”](#grafana-loki)
Loki is a horizontally scalable log aggregation system inspired by Prometheus. Its defining design choice is that it indexes only labels — a small set of key/value pairs attached to each stream — and stores the raw log lines as compressed chunks in object storage. That makes ingestion and storage cheap, at the cost of pushing content search into a scan of the matched chunks.
* **Storage**: object storage (S3/GCS/Azure/filesystem), label index only
* **Ingestion**: owns it — agents such as Promtail or Grafana Alloy push streams into Loki
* **Query language**: LogQL (label selectors plus filter expressions and metric queries)
* **Signals**: logs; correlates with metrics (Prometheus/Mimir) and traces (Tempo) inside the Grafana LGTM stack
* **UI**: Grafana (Explore, dashboards, alerting) — Loki itself has no UI
* **License**: AGPLv3 (Grafana relicensed Loki in 2024)
## Feature comparison
[Section titled “Feature comparison”](#feature-comparison)
| | Logchef | Grafana Loki |
| ----------------------- | ------------------------------------------------------------- | ---------------------------------------------------------------------- |
| Role | Query UI over existing storage | Full log backend (ingest + store + query) |
| Backend(s) | ClickHouse, VictoriaLogs | Loki’s own object-storage engine |
| Owns ingestion? | No — reads existing data | Yes — via Promtail / Alloy agents |
| Indexing model | Backend columns/fields (high-cardinality OK) | Labels only; content is scanned, not indexed |
| High-cardinality fields | Handled well (columnar / per-field) | A known weak spot — too many label values hurt performance |
| Full-text search | Yes (tokenized indexes on ClickHouse, native on VictoriaLogs) | Filter expressions scan matched chunks; no content index |
| Query languages | LogchefQL, ClickHouse SQL, VictoriaLogs LogsQL | LogQL |
| SQL / ad-hoc analytics | Yes (native ClickHouse SQL) | No SQL; LogQL metric queries only |
| Built-in UI | Yes (explorer, dashboards, alerting, RBAC) | No — uses Grafana |
| Signals | Logs | Logs (metrics/traces via the wider LGTM stack) |
| Alerting | Scheduled query evaluation, email/webhook | Loki ruler + Grafana alerting |
| RBAC | Team-based, OIDC/SSO or local auth | Via Grafana / tenant setup |
| Deployment footprint | Single binary + your ClickHouse/VictoriaLogs | Loki (single- or micro-service mode) + agents + object store + Grafana |
| Cheapest-storage story | Depends on the backend you run | Strong — compressed chunks on cheap object storage |
## When Logchef is the better choice
[Section titled “When Logchef is the better choice”](#when-logchef-is-the-better-choice)
* You already store logs in **ClickHouse or VictoriaLogs**, or want to, and need a UI without adopting a new backend.
* You query on **high-cardinality fields** (request IDs, user IDs, trace IDs) where Loki’s label model struggles.
* You want **SQL** and real analytical queries over logs, not just filtering.
* You want a **dedicated log UI** — with dashboards, alerting, saved queries, and team access control — without standing up Grafana and its stack.
* You’d rather run a **single binary** against storage you already operate.
Notably, **VictoriaLogs is itself frequently adopted as a Loki alternative** — so “Logchef in front of VictoriaLogs” is a direct, self-hosted alternative to a Loki + Grafana setup, with stronger full-text and high-cardinality behavior.
## When Grafana Loki is the better choice
[Section titled “When Grafana Loki is the better choice”](#when-grafana-loki-is-the-better-choice)
* You’re **all-in on Grafana** and want logs correlated with Prometheus metrics and Tempo traces in one UI.
* Your logs are **high-volume but low-cardinality**, and object-storage cost is the primary concern.
* You want a **turnkey ingest-to-store pipeline** (agents + backend) rather than running ClickHouse or VictoriaLogs yourself.
* Your team already knows **LogQL** and lives in Grafana Explore.
## They can coexist
[Section titled “They can coexist”](#they-can-coexist)
These aren’t mutually exclusive. A common split: keep Grafana + Loki (or Prometheus/Tempo) for metrics, traces, and cheap high-volume logs, and point Logchef at a ClickHouse or VictoriaLogs source for the log workloads that need high-cardinality search and SQL analysis. Logchef reads your existing storage, so adding it doesn’t disturb an existing Grafana setup.
## Further reading
[Section titled “Further reading”](#further-reading)
* [Logchef architecture](/core/architecture/)
* [Connecting VictoriaLogs](/tutorials/victorialogs/)
* [Schema design](/integration/schema-design/)
* [Dashboards](/features/dashboards/) and [alerting](/features/alerting/)
# Roadmap
> What Logchef has shipped recently, what's being built now, and where the log analytics project is headed next.
This is a snapshot of where Logchef is and where it’s going. Near-term items are a committed direction, not dated promises. Timelines shift as we learn.
## Recently shipped
[Section titled “Recently shipped”](#recently-shipped)
* **Dashboards**: grids of saved visualizations (time series, stat, and table panels) with a shared time range and auto-refresh; panels can mix ClickHouse and VictoriaLogs sources (v2.0). See [dashboards](/features/dashboards).
* **VictoriaLogs as a first-class datasource** (v2.0): LogchefQL compiles to LogsQL as well as ClickHouse SQL, with a native LogsQL editor and a capability-driven UI that adapts to what each backend supports.
* **Built-in local authentication** (v2.0): run Logchef with email+password auth, with or without an external OIDC provider.
* **Live tail** (v2.0): follow matching logs as they arrive, on both ClickHouse and VictoriaLogs sources.
* **Streaming query responses** (v2.0): ClickHouse preview queries stream row-by-row instead of buffering the full result in memory, removing a memory-spike path on large result sets.
* **Pluggable metadata store**: SQLite by default, with Postgres for multi-replica HA deployments (v1.7). See [database backends](/operations/database-backends/).
* **Redesigned Library**: collections with per-collection roles (v1.7). See [collections](/features/collections).
* **Scoped API tokens + service accounts**: non-interactive access with fine-grained scopes (v1.6.1). See [service tokens](/features/service-tokens).
* **Collections & editor team role**: shared saved queries and a dedicated editor role (v1.6).
* **Alerting**: SQL-based conditions with email and webhook delivery (v1.0+). See [alerting](/features/alerting).
* **Rust CLI**: `logchef` covers auth, teams/sources/schema discovery, query/sql/explain, fields/histogram, native SSE tail, find, open, collections/saved-queries, doctor, and completions — plus VictoriaLogs parity and a `--quiet` scripting mode. See [the CLI docs](/integration/cli).
* **MCP server**: exposes Logchef to AI assistants over the Model Context Protocol. See [the MCP server docs](/integration/mcp-server).
## Next
[Section titled “Next”](#next)
Near-term direction we’re committed to:
* **Explore performance**: virtualized rendering for very large result sets.
* **Alert-scheduler leader election**: so alerting runs correctly across multiple replicas.
## Later / exploring
[Section titled “Later / exploring”](#later--exploring)
Directions we’re interested in but haven’t committed to:
* Server-side persistent query history.
* Additional datasource backends: the provider interface is designed to accommodate them.
## Get involved
[Section titled “Get involved”](#get-involved)
Feedback and contributions are welcome. Open an issue or start a discussion on [GitHub](https://github.com/mr-karan/logchef).
# Development Setup
> Complete guide to setting up a local Logchef development environment for building and contributing to the project.
This guide covers multiple ways to set up your Logchef development environment.
## Prerequisites
[Section titled “Prerequisites”](#prerequisites)
Logchef requires:
* **Go 1.27+** - Backend development
* **Bun 1.4.2** - Frontend and docs package manager (the version CI uses)
* **Rust** - CLI development (optional, only if working on CLI)
* **Docker** - For running ClickHouse and test infrastructure
* **just** - Command runner for development tasks
* **sqlc v1.31.1** - SQL code generation
* **golangci-lint v2.14.0** - Go linting. `just lint` fails if your version differs from the one pinned in `.github/workflows/go-tests.yml`.
## Installation
[Section titled “Installation”](#installation)
Install dependencies using your system’s package manager (or the methods below).
#### Go Installation
[Section titled “Go Installation”](#go-installation)
Download Go 1.27 or newer from [go.dev/dl](https://go.dev/dl/), or use your package manager (for example `brew install go`).
#### Bun
[Section titled “Bun”](#bun)
Install Bun with your package manager (for example `brew install oven-sh/bun/bun`), or follow [bun.sh/docs/installation](https://bun.sh/docs/installation). The frontend lockfile is `frontend/bun.lock`; do not use npm, pnpm, or yarn.
#### Additional Tools
[Section titled “Additional Tools”](#additional-tools)
```bash
# just - command runner
cargo install just
# sqlc - SQL code generator (pin the version CI uses)
go install github.com/sqlc-dev/sqlc/cmd/sqlc@v1.31.1
# golangci-lint - install the pinned release binary, for example:
brew install golangci-lint
golangci-lint version # must print 2.14.0
# Docker - follow official docs for your OS
# https://docs.docker.com/engine/install/
```
## Initial Setup
[Section titled “Initial Setup”](#initial-setup)
After installing dependencies:
### 1. Generate Database Code
[Section titled “1. Generate Database Code”](#1-generate-database-code)
```bash
# Generate SQLC code from SQL queries
just sqlc-generate
```
### 2. Start Development Infrastructure
[Section titled “2. Start Development Infrastructure”](#2-start-development-infrastructure)
```bash
# Start ClickHouse and Dex OIDC provider
just dev-docker
```
This starts:
* ClickHouse on port 9000 (HTTP: 8123)
* Dex OIDC provider on port 5556
* Sample log data and configurations
### 3. Build the Application
[Section titled “3. Build the Application”](#3-build-the-application)
```bash
# Build backend + frontend
just build
# Or build separately
just build-backend
just build-frontend
```
### 4. Run Logchef
[Section titled “4. Run Logchef”](#4-run-logchef)
```bash
# Run with development config
just CONFIG=dev/config.toml run
# Or run backend/frontend separately
just run-backend
just run-frontend # In another terminal
```
Access Logchef at `http://localhost:8125`
## Development Workflow
[Section titled “Development Workflow”](#development-workflow)
### Common Commands
[Section titled “Common Commands”](#common-commands)
```bash
# Run all checks (format, vet, lint, sqlc, tests)
just check
# Run tests with coverage
just test
# Run tests without coverage (faster)
just test-short
# Format code
just fmt
# Lint code
just lint
# Vet code
just vet
```
### Working with Database Changes
[Section titled “Working with Database Changes”](#working-with-database-changes)
1. Modify migrations in `internal/store/sqlite/migrations/`
2. Update queries in `internal/store/sqlite/queries.sql`
3. Regenerate code:
```bash
just sqlc-generate
```
4. Update models in `pkg/models/` if needed
### Frontend Development
[Section titled “Frontend Development”](#frontend-development)
```bash
cd frontend/
# Development server with hot reload
bun run dev
# Type checking
bun run typecheck
# Unit tests
bun run test
# Build for production
bun run build
```
### CLI Development
[Section titled “CLI Development”](#cli-development)
The CLI is written in Rust and lives in the `cli/` directory:
```bash
# Build debug version (fast compilation)
just build-cli-debug
# Build release version (optimized)
just build-cli
# Run tests
just test-cli
# Lint with clippy
just lint-cli
# Format code
just fmt-cli
# Run all CLI checks
just check-cli
```
The debug binary is at `cli/target/debug/logchef`, release at `cli/target/release/logchef`.
### Docker Development
[Section titled “Docker Development”](#docker-development)
```bash
# Build Docker image
just build-docker
# Run with Docker Compose
docker compose -f deployment/docker/docker-compose.yml up
```
## Troubleshooting
[Section titled “Troubleshooting”](#troubleshooting)
### SQLC Generation Fails
[Section titled “SQLC Generation Fails”](#sqlc-generation-fails)
Ensure sqlc is installed and in your PATH:
```bash
sqlc version
```
### Frontend Build Errors
[Section titled “Frontend Build Errors”](#frontend-build-errors)
Reinstall dependencies from the lockfile:
```bash
cd frontend/
bun install --frozen-lockfile
```
### Docker Permission Issues
[Section titled “Docker Permission Issues”](#docker-permission-issues)
Add your user to the docker group:
```bash
sudo usermod -aG docker $USER
newgrp docker
```
### Port Already in Use
[Section titled “Port Already in Use”](#port-already-in-use)
Check if another process is using the required ports:
```bash
# Backend (8125)
lsof -i :8125
# ClickHouse (9000, 8123)
lsof -i :9000
lsof -i :8123
```
## Next Steps
[Section titled “Next Steps”](#next-steps)
* Review the [Architecture Overview](/core/architecture) to understand the codebase
* See [Roadmap](/contributing/roadmap) for upcoming features
* Read the main [CONTRIBUTING.md](https://github.com/mr-karan/logchef/blob/main/CONTRIBUTING.md) for contribution guidelines
# Architecture
> Overview of Logchef's architecture, components, and data flow powering its ClickHouse and VictoriaLogs log analytics engine.
## Architectural Overview
[Section titled “Architectural Overview”](#architectural-overview)
Logchef is a specialized query and visualization layer on top of external log storage backends. Its design keeps a clear separation of concerns:
* **Query Engine**: Core focus on transforming user intent into the selected datasource’s native query language
* **No Ingestion Pipeline**: The architecture intentionally excludes log collection and focuses only on the query interface
* **Datasource Providers**: Backend-specific provider layers for ClickHouse and VictoriaLogs while keeping a shared application control plane
This means Logchef can reuse the existing ecosystem of log collection tools while giving you a dedicated interface for exploring logs once they land in ClickHouse, VictoriaLogs, or future supported backends.
## System Overview
[Section titled “System Overview”](#system-overview)
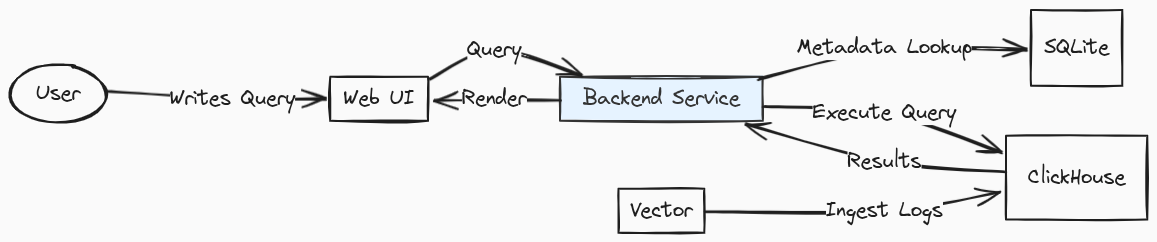
### Technology Stack
[Section titled “Technology Stack”](#technology-stack)
#### Backend
[Section titled “Backend”](#backend)
* **Go**: Logchef’s core backend is written in Go for performance and concurrency
* **SQLite**: Lightweight database used for metadata storage of users, teams, sources, and saved queries
* **ClickHouse**: High-performance columnar database optimized for analytical queries on log data
* **VictoriaLogs**: Log-native storage engine accessed via LogsQL and HTTP APIs
#### Frontend
[Section titled “Frontend”](#frontend)
* **Vue.js**: Modern JavaScript framework used to build the reactive user interface
* **Tailwind CSS**: Utility-first CSS framework for styling the UI components
## Core Components
[Section titled “Core Components”](#core-components)
### 1. Query Engine
[Section titled “1. Query Engine”](#1-query-engine)
* Converts LogchefQL to the selected datasource’s native query language
* Manages query execution across multiple sources
* Supports both simple search syntax and datasource-native query modes for complex queries
### 2. Authentication Service
[Section titled “2. Authentication Service”](#2-authentication-service)
* Integrates with OIDC providers (like Keycloak, Zitadel etc)
* Manages user sessions and authorization
* Enforces role-based access control
### 3. Source Manager
[Section titled “3. Source Manager”](#3-source-manager)
* Manages connections to remote datasource backends
* Handles source registration and validation
* Provides connection pooling mechanisms
## Data Flow
[Section titled “Data Flow”](#data-flow)
1. **Log Ingestion** (external to Logchef):
* Various collectors (Vector, Filebeat, etc.) send logs to ClickHouse, VictoriaLogs, or other storage systems outside Logchef
* Each collector handles its own schema mapping and transformations
2. **Log Querying** (Logchef’s domain):
* Users construct queries via the UI (LogchefQL or native mode)
* Logchef translates LogchefQL to SQL for ClickHouse or LogsQL for VictoriaLogs
* Queries are executed against the appropriate datasource source(s)
* Logchef processes, formats, and displays the results in the UI
## Data Storage
[Section titled “Data Storage”](#data-storage)
### SQLite Metadata Store
[Section titled “SQLite Metadata Store”](#sqlite-metadata-store)
SQLite manages all system configuration and relationships:
* **Sources**: Connection details and metadata for remote datasource backends
* **Users**: Account information and authentication data
* **Teams**: Organizational units with role-based access
* **Saved Queries**: Team-specific saved queries with explicit query language and editor mode metadata
### Datasource Backends
[Section titled “Datasource Backends”](#datasource-backends)
Logchef connects to remote datasource backends as sources:
* **ClickHouse sources** can:
* Use the default OTEL schema as-is
* Customize the built-in OpenTelemetry (OTEL) schema
* Use custom schemas
* **VictoriaLogs sources** can:
* Connect directly to a VictoriaLogs base URL
* Apply tenant headers and immutable scope filters
* Use dynamically discovered fields instead of a fixed SQL schema
* **Requirements**:
* ClickHouse requires a timestamp field (DateTime/DateTime64)
* VictoriaLogs defaults to `_time`
* **Schema Agnostic**: Beyond the timestamp field, Logchef works with provider-specific field discovery and schema metadata
## Deployment Considerations
[Section titled “Deployment Considerations”](#deployment-considerations)
* **Single Binary**: Logchef runs as a lightweight single binary with minimal resource requirements
* **Stateless Operation**: Core application is stateless for horizontal scaling (only SQLite metadata is persistent)
* **Proxying**: Can be deployed behind reverse proxies like Nginx or Caddy
## Next steps
[Section titled “Next steps”](#next-steps)
* See [Database Backends & High Availability](/operations/database-backends) for running more than one replica
* Review [ClickHouse Schema Design](/integration/schema-design) for the log table schema Logchef expects
* Check [Teams, Sources & Access Control](/core/user-management) for how access is scoped
# Teams & Access Control
> How Logchef organizes users into Teams, controls access to log Sources, and enforces permissions across the platform.
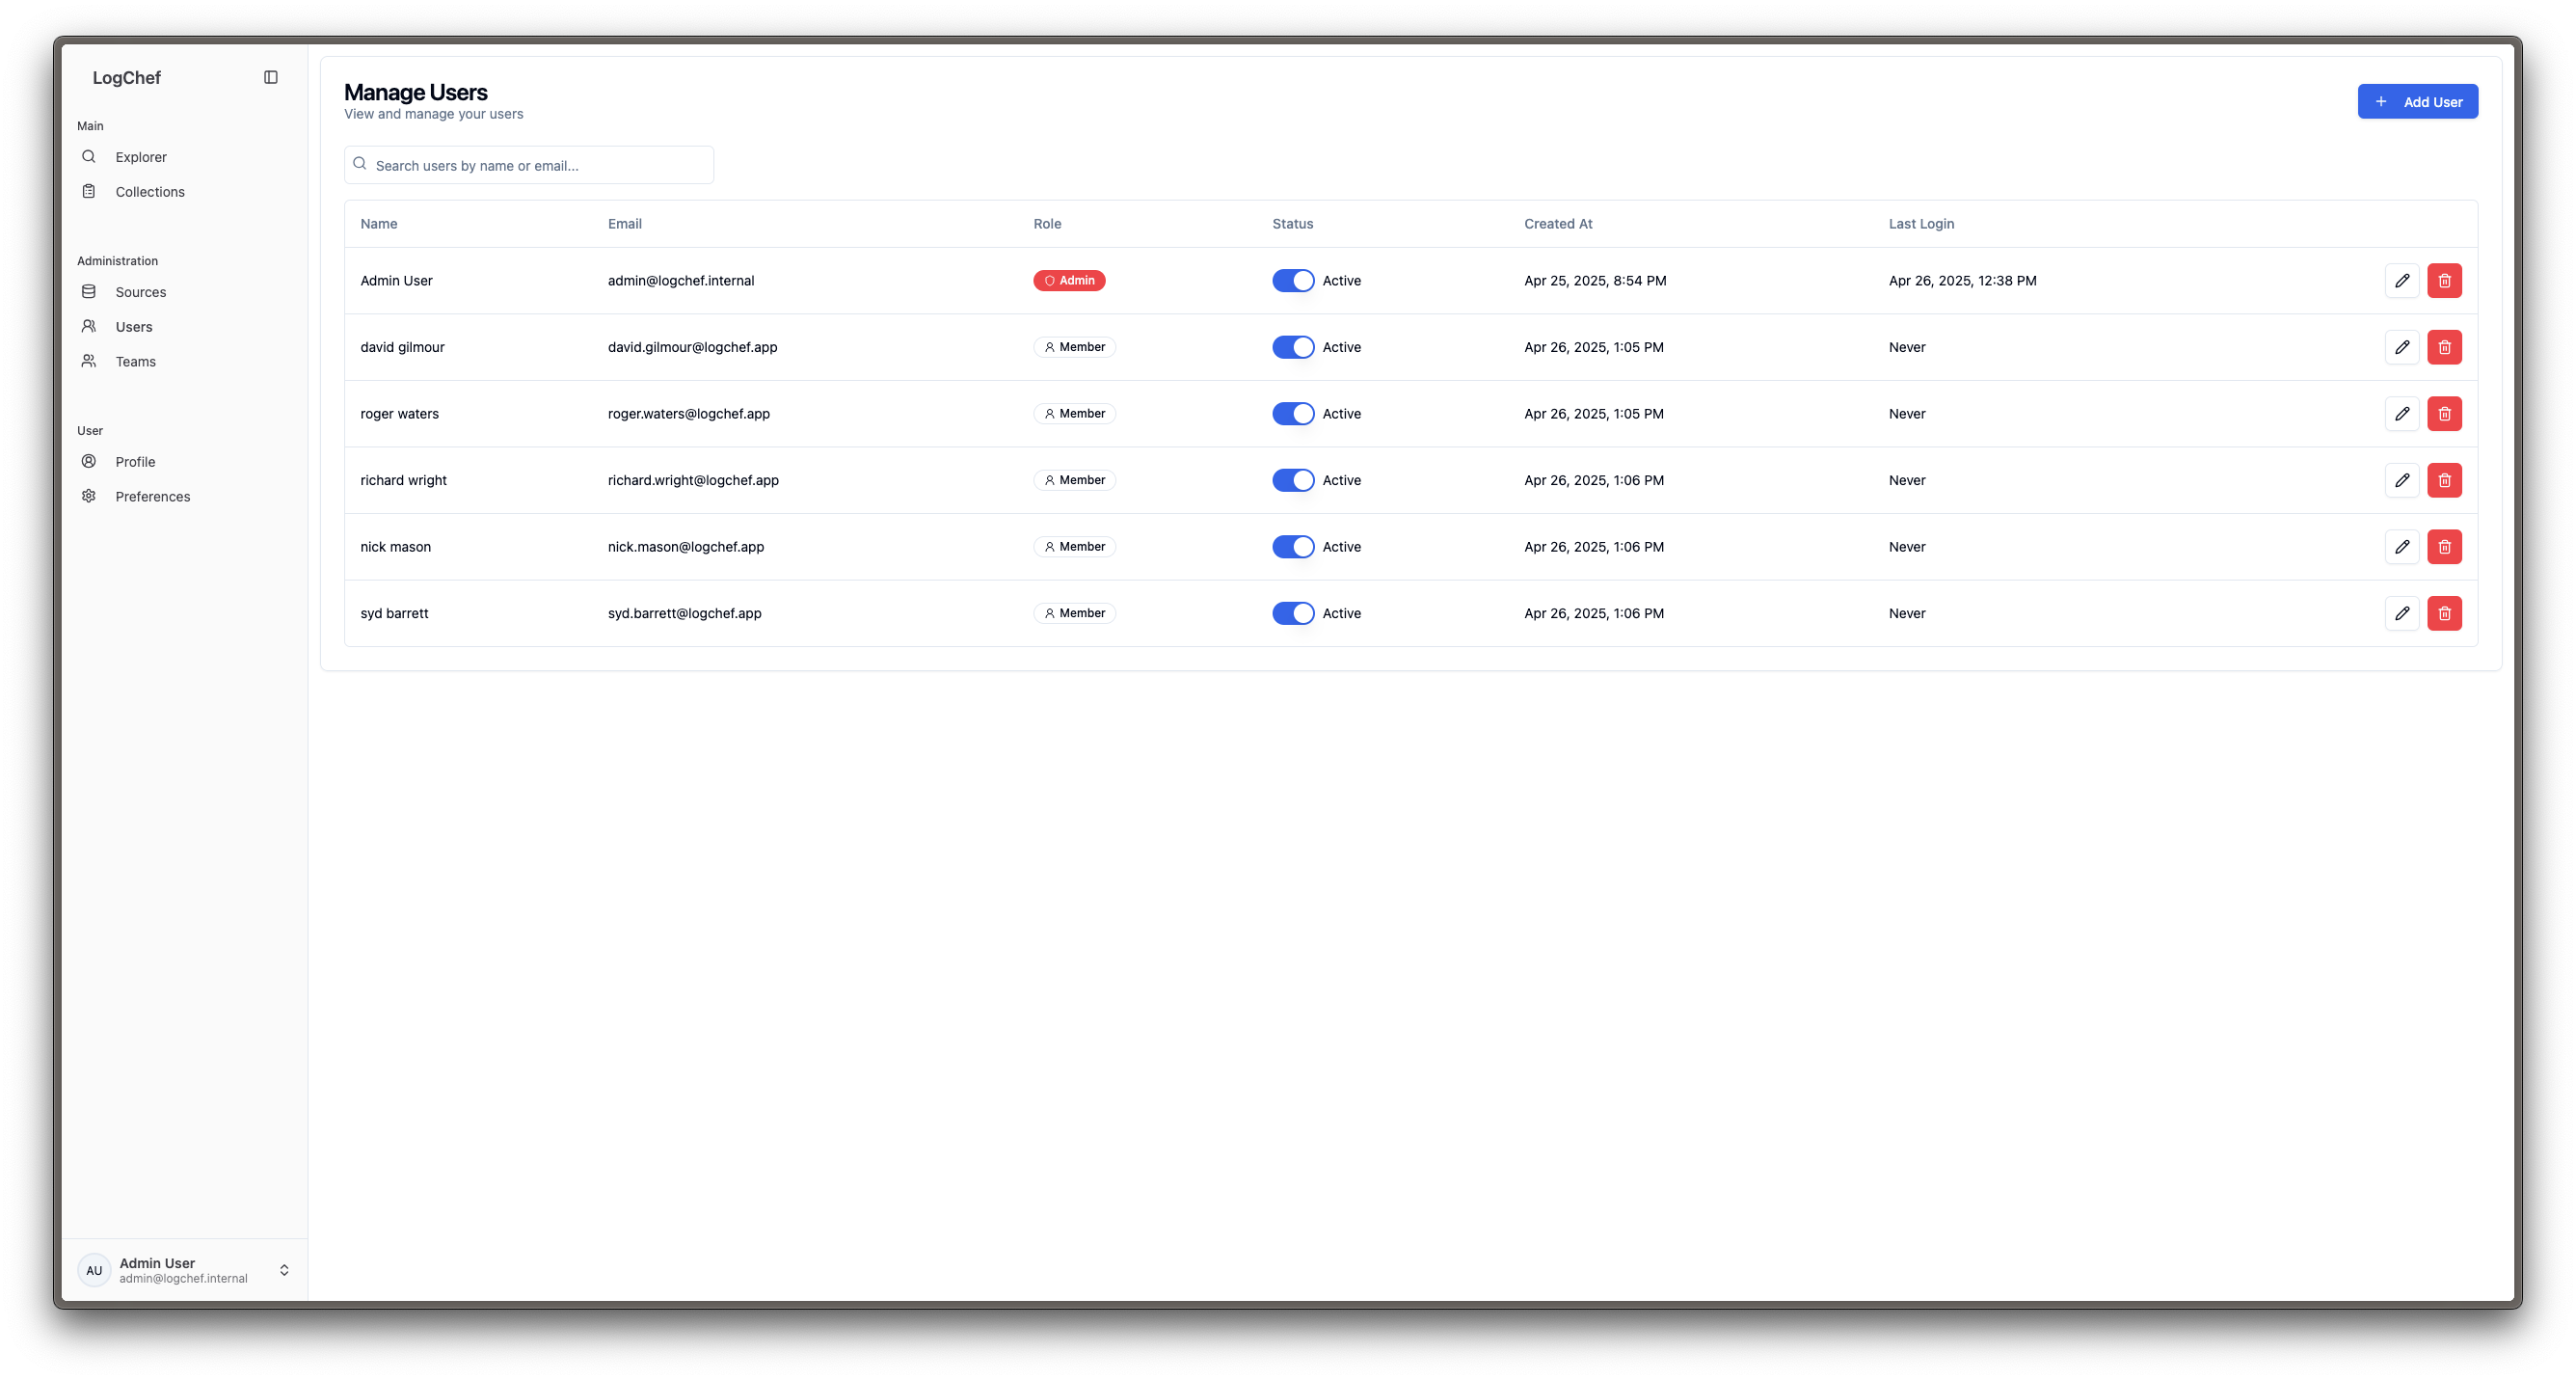
Logchef implements a team-based access control system that helps organize and secure your log data. This guide explains the core concepts of user management and how to effectively use them.
## Authentication
[Section titled “Authentication”](#authentication)
Users sign in via **OIDC/SSO**, or via built-in **email+password** authentication if your instance has it enabled. See [Local authentication](/getting-started/configuration/#local-authentication-run-without-oidc) to run Logchef without an external identity provider. Both can be enabled at once.
By default an OIDC login only works for users that already exist in Logchef. With [SSO auto-provisioning](/getting-started/configuration/#sso-auto-provisioning-jit-user-creation) enabled, a first-time login from an allowed email domain creates the user automatically as a regular member, optionally joining a set of default teams.
## Sources
[Section titled “Sources”](#sources)
A Source in Logchef represents a distinct datasource-backed log scope that users can query independently. Depending on the backend, a source may map to a ClickHouse table or to a VictoriaLogs connection plus optional tenant/scope boundaries.
### Key Aspects of Sources
[Section titled “Key Aspects of Sources”](#key-aspects-of-sources)
* Each Source belongs to a specific datasource backend
* ClickHouse sources map to a specific `database.table`
* VictoriaLogs sources map to a base URL plus optional tenant and scope configuration
* Sources can represent different applications, services, or environments
* Sources have their own schema and configuration
* Access to Sources is controlled through Team assignments
### Example Sources
[Section titled “Example Sources”](#example-sources)
```plaintext
app-production-logs → Production application logs in ClickHouse
nginx-access-logs → Web server access logs in VictoriaLogs
kubernetes-events → Cluster events scoped to a specific source
```
## Teams
[Section titled “Teams”](#teams)
Teams are the primary mechanism for managing access control in Logchef. They create logical groupings of users and determine which Sources they can access.
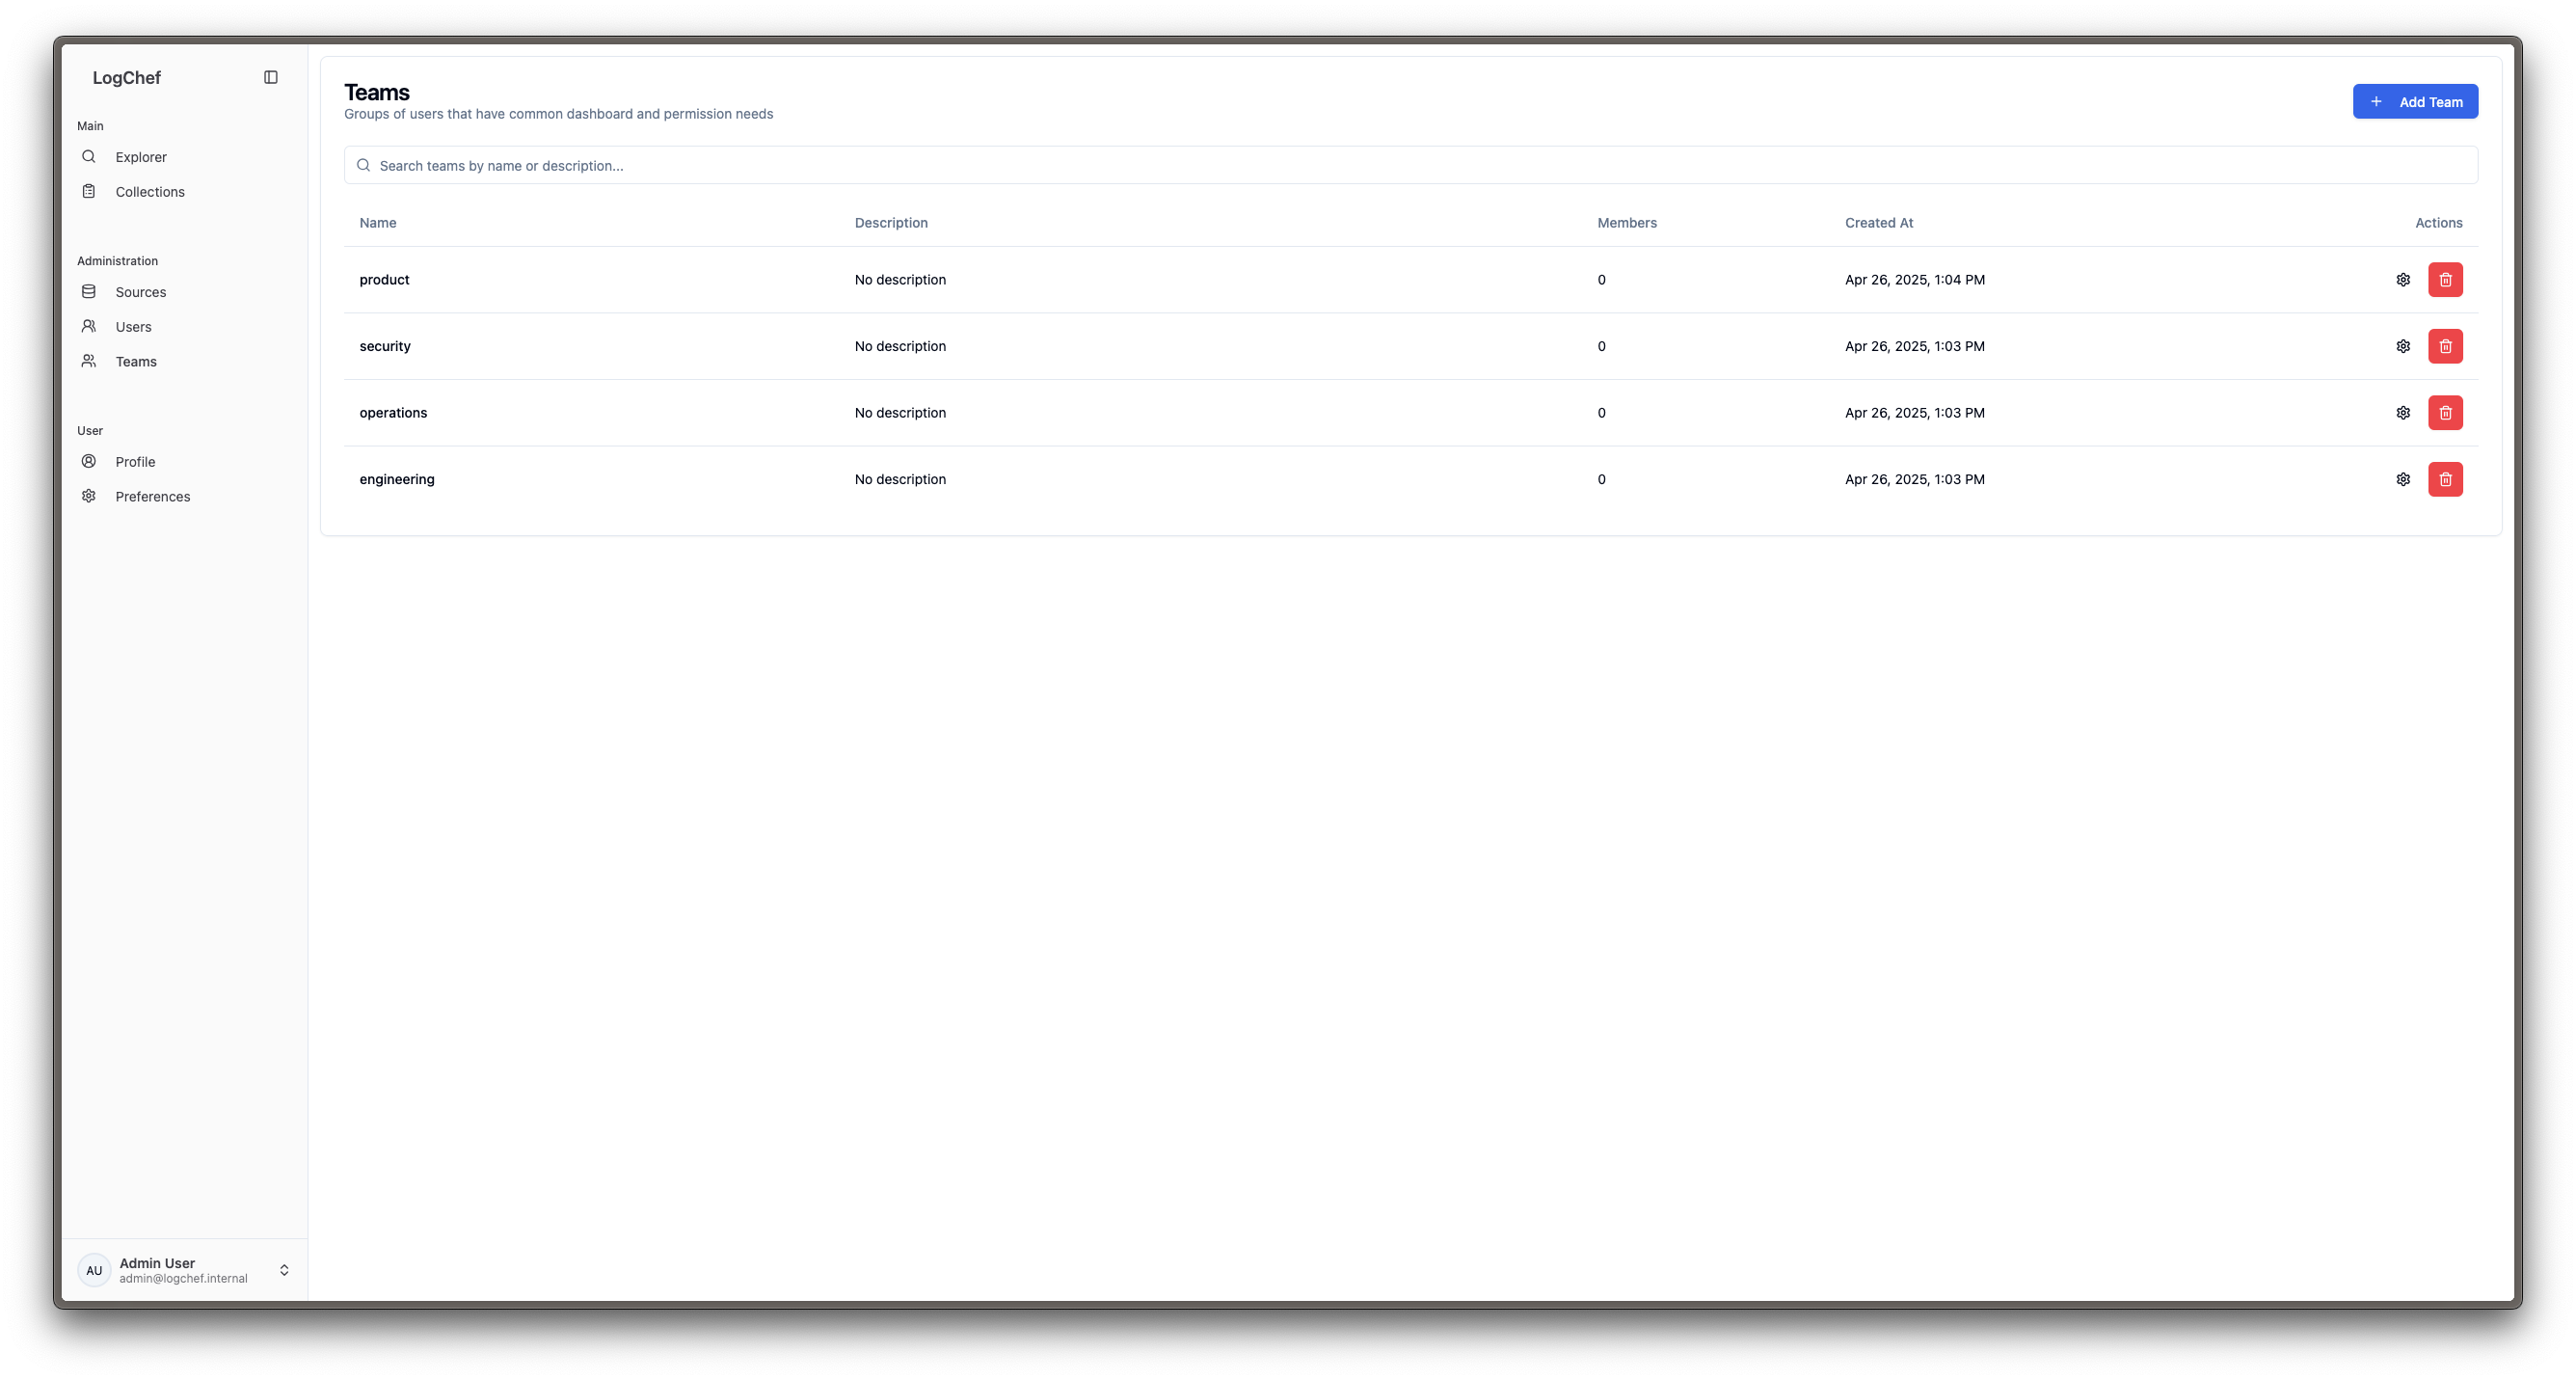
### How Teams Work
[Section titled “How Teams Work”](#how-teams-work)
* Users are assigned to one or more Teams
* Sources are associated with specific Teams
* Users can only access Sources that belong to their Teams
* Teams help maintain data isolation and security
### Example Team Structure
[Section titled “Example Team Structure”](#example-team-structure)
```plaintext
Infrastructure Team → Access to system logs, metrics
Application Team → Access to application logs
Security Team → Access to audit logs, security events
DevOps Team → Access to deployment logs, monitoring
```
## Role Model
[Section titled “Role Model”](#role-model)
Logchef evaluates access at multiple layers instead of relying on one coarse administrator flag. The complete model is included in the open-source release.
| Layer | Roles | What it controls |
| -------------- | --------------------------- | ----------------------------------------------------------------------------- |
| **Instance** | `admin`, `member` | Global administration of users, teams, sources, and system settings |
| **Team** | `admin`, `editor`, `member` | Access to sources assigned to that team and delegated team-level management |
| **Collection** | `owner`, `editor`, `member` | Who can run, edit, curate, or administer a shared collection of saved queries |
Roles are intentionally separate. A user can administer one team, edit shared workflows in another, and remain a regular member elsewhere. Collection roles delegate ownership of shared queries without granting access to the underlying log source.
For automation, [service accounts and scoped tokens](/features/service-tokens) add two independent checks. The token must allow the requested action, and the service account must belong to a team that can access the source. The strictest layer wins.
This produces a few important guarantees:
* Joining a collection, directly or through a team it is shared with, never grants access to its logs. A team share grants only the collection Member role.
* Team membership only exposes sources explicitly assigned to that team.
* Team admins can manage members and source assignments without becoming global admins.
* Scoped service tokens can be limited by both action and source access.
* Teams, memberships, and source assignments can be reconciled from [version-controlled provisioning](/getting-started/provisioning).
## Access Control Flow
[Section titled “Access Control Flow”](#access-control-flow)
1. When a user logs in, Logchef identifies their Team memberships
2. The UI only displays Sources associated with the user’s Teams
3. All queries are automatically filtered based on Team permissions
4. Users cannot access or query Sources outside their Team’s scope
## Best Practices
[Section titled “Best Practices”](#best-practices)
1. **Source Organization**
* Use clear, consistent naming for Sources
* Document the schema and purpose of each Source
* Consider environment and application boundaries when creating Sources
2. **Team Management**
* Create Teams based on functional responsibilities
* Regularly audit Team memberships
* Follow the principle of least privilege
* Consider creating read-only Teams for auditors or external users
3. **Access Patterns**
* Group related Sources under the same Team
* Use separate Sources for sensitive data
* Consider creating cross-functional Teams for specific projects
## Next steps
[Section titled “Next steps”](#next-steps)
* Manage teams and sources as code with [Declarative Provisioning](/getting-started/provisioning)
* Set up non-login automation access with [Service Tokens](/features/service-tokens)
* Share queries across a team with [Collections](/features/collections)
# AI Query Generation
> Generate LogchefQL, ClickHouse SQL, or LogsQL from natural language with schema-aware AI.
Logchef turns natural-language questions into queries for whichever datasource and editor mode you are using. It generates LogchefQL in the shared builder, ClickHouse SQL in ClickHouse native mode, and LogsQL in VictoriaLogs native mode. The assistant is schema-aware: it sees the selected source’s columns or discovered fields and types.
## Usage
[Section titled “Usage”](#usage)
1. Open any log source
2. Click the AI assistant button (wand icon) in the query editor
3. Describe what you want in plain English
4. Review the generated query, then insert it into the editor
If you already have a query in the editor, the AI uses it as context for refinements. Logchef validates the generated query for the active target and makes one repair attempt when it can identify a syntax error.
## Example Queries
[Section titled “Example Queries”](#example-queries)
```plaintext
"Show error logs from the last 6 hours"
"Count logs by severity for today"
"Find logs containing 'connection refused' from the payments service"
"Top 10 most frequent error messages this week"
"Logs where trace_id = 'abc123'"
```
## Configuration
[Section titled “Configuration”](#configuration)
Configure via **Administration → System Settings → AI**:
| Setting | Description | Default |
| ----------- | -------------------------------------- | --------------------------- |
| Enabled | Toggle AI features | `true` |
| Provider | `openai` or native `bedrock` transport | `openai` |
| API Key | Your OpenAI API key | — |
| Base URL | API endpoint | `https://api.openai.com/v1` |
| Region | AWS region when using Bedrock | — |
| Model | Model name | `gpt-4o` |
| Max Tokens | Max tokens to generate | `1024` |
| Temperature | Randomness (0.0–1.0) | `0.1` |
### Supported Providers
[Section titled “Supported Providers”](#supported-providers)
Use an OpenAI-compatible API or AWS Bedrock:
| Provider | Base URL |
| ------------ | ----------------------------------------------------------- |
| OpenAI | `https://api.openai.com/v1` (default) |
| OpenRouter | `https://openrouter.ai/api/v1` |
| Azure OpenAI | Your Azure endpoint |
| Local models | Your local server URL |
| AWS Bedrock | Native Converse API using the standard AWS credential chain |
### Environment Variables
[Section titled “Environment Variables”](#environment-variables)
For containerized deployments, seed the initial config via env vars:
```bash
export LOGCHEF_AI__ENABLED=true
export LOGCHEF_AI__PROVIDER=openai
export LOGCHEF_AI__API_KEY="sk-your-key"
export LOGCHEF_AI__MODEL="gpt-4o"
```
For Bedrock, set `LOGCHEF_AI__PROVIDER=bedrock`, `LOGCHEF_AI__REGION`, and a Bedrock model ID or inference-profile ARN. Logchef uses the normal AWS credential chain, so no API key is stored.
After first boot, the Admin UI takes precedence over env vars.
## MCP Integration
[Section titled “MCP Integration”](#mcp-integration)
For AI assistant integration outside the web UI (e.g., Claude Desktop), see [MCP Server](/integration/mcp-server).
## Limitations
[Section titled “Limitations”](#limitations)
Always review AI-generated queries before running them. The model can get complex aggregations or unfamiliar schemas wrong, so start with simple questions and iterate from there.
# Alerting
> Set up scheduled log alerts on ClickHouse or VictoriaLogs sources with email and webhook notifications when thresholds are exceeded.
Logchef evaluates alert queries on a schedule and sends notifications when thresholds are exceeded. Alerts fire via email (SMTP) and webhooks, so you don’t need a separate alerting system.
## Quick Start
[Section titled “Quick Start”](#quick-start)
1. Navigate to your team/source → **Alerts** → **New Alert**
2. Choose a query mode supported by the source
3. Write a filter or native query
4. Set threshold: greater than 100
5. Set lookback: 5 minutes, frequency: 60 seconds
6. Add recipients and/or webhook URLs
7. Save
For ClickHouse and VictoriaLogs sources, Logchef can generate the executable alert query automatically from a LogchefQL condition. Native mode remains available when you want to write SQL or LogsQL directly.
## Query Modes
[Section titled “Query Modes”](#query-modes)
**Condition mode**: Write a LogchefQL filter condition and pick an aggregate function (`count`, `sum`, `avg`, `min`, `max`). For anything beyond `count`, also pick the field to aggregate over: schema-backed suggestions show all fields for VictoriaLogs sources and numeric columns for ClickHouse. Logchef generates the backend-native executable query and adds the alert window automatically.
```plaintext
severity_text = "ERROR"
status_code >= 500 and service = "api"
body ~ "timeout"
```
**Native mode**: Write the source’s native alert query. The query must return a single numeric value.
```sql
SELECT avg(JSONExtractFloat(log_attributes, 'response_time_ms')) as value
FROM logs
WHERE service = 'api-gateway'
AND timestamp >= now() - toIntervalSecond(600)
```
For VictoriaLogs sources, native mode uses LogsQL and evaluates through `stats_query`. Logchef applies the configured lookback window automatically, so the query can stay focused on the filter and stats logic.
```text
level:="error" | stats count() as value
```
## Alert Configuration
[Section titled “Alert Configuration”](#alert-configuration)
| Field | Description |
| ------------ | ------------------------------------------------------------------------------- |
| Name | Human-readable identifier |
| Severity | `info`, `warning`, or `critical` |
| Query | LogchefQL condition, ClickHouse SQL, or VictoriaLogs LogsQL depending on source |
| Threshold | Value + operator (`>`, `>=`, `<`, `<=`, `==`, `!=`) |
| Frequency | Evaluation interval in seconds |
| Lookback | Time range for the query |
| Recipients | Team members to email |
| Webhook URLs | HTTP endpoints to POST payloads to |
## Notifications
[Section titled “Notifications”](#notifications)
### Email (SMTP)
[Section titled “Email (SMTP)”](#email-smtp)
Configure SMTP in **Administration → System Settings → Alerts**:
| Setting | Example |
| ------------- | -------------------- |
| SMTP Host | `smtp.example.com` |
| SMTP Port | `587` |
| SMTP Security | `starttls` |
| SMTP From | `alerts@example.com` |
### Webhooks
[Section titled “Webhooks”](#webhooks)
Add webhook URLs per alert. Logchef POSTs a JSON payload containing:
* Alert name, severity, status (`triggered` / `resolved`)
* The query result value and threshold
* Labels (team, source, custom key-value pairs)
* Annotations (description, runbook URL, query text)
Works with Slack incoming webhooks, PagerDuty, or any HTTP endpoint.
### Labels and Annotations
[Section titled “Labels and Annotations”](#labels-and-annotations)
Add custom labels for routing and annotations for context:
```json
{
"labels": { "env": "production", "service": "payment-api" },
"annotations": { "runbook": "https://wiki.example.com/high-error-rate" }
}
```
## Reliability
[Section titled “Reliability”](#reliability)
* Failed deliveries retry with exponential backoff (500ms → 1s → 2s)
* Delivery outcomes recorded in alert history
* Resolution notifications sent when conditions clear
## Dashboard
[Section titled “Dashboard”](#dashboard)
The alerts list shows live status for each rule:
* Toggle alerts on/off directly from the list
* Red pulsing dot = firing, green dot = resolved
* Duplicate existing alerts for similar conditions
* View full evaluation history per alert
## SMTP Configuration (First Boot)
[Section titled “SMTP Configuration (First Boot)”](#smtp-configuration-first-boot)
Seed initial settings via `config.toml`. After first boot, use the Admin UI:
```toml
[alerts]
enabled = true
evaluation_interval = "1m"
smtp_host = "smtp.example.com"
smtp_port = 587
smtp_from = "alerts@example.com"
smtp_security = "starttls"
```
`enabled` is the **server-wide** alerting switch. With `alerts.enabled = false` (or `LOGCHEF_ALERTS__ENABLED=false`) Logchef hides all alerting UI and every alert endpoint returns `503`. That’s useful for exploration-only deployments, or to keep alert evaluation on a single instance when running multiple replicas against a shared [Postgres backend](/operations/database-backends/).
## Troubleshooting
[Section titled “Troubleshooting”](#troubleshooting)
**Alerts not firing:** Check the alert is enabled, test the query manually, verify the threshold makes sense for your data volume, and confirm the selected query language matches the source type.
**Alerts not delivered:** Verify SMTP settings, check that recipients or webhook URLs are configured on the alert, review delivery status in alert history.
**False positives:** Increase the threshold, extend the lookback window, or use `avg()` instead of `count()` for smoother signals.
For VictoriaLogs-specific guidance, see [Using VictoriaLogs with Logchef](/tutorials/victorialogs).
# Collections & Saved Queries
> Save queries to your Library and share them with teammates through collections.
Your **Library** holds saved queries; **collections** are shared playlists for organizing them. Members run queries, editors change the shared query, and owners manage the collection, but a collection never grants access to log data.
Open the Library from the sidebar. Collections sit in the left rail; selecting one shows its queries, members, and shared teams on the right.
## Saved queries
[Section titled “Saved queries”](#saved-queries)
A saved query is a named, reusable query bound to a single source. It stores the query text (LogchefQL or SQL), and optionally the time range, limit, and variables.
Save one from the explorer with **Save**. The dialog asks for a name and lets you pick a collection in the same step (defaulting to your personal collection), so saving and organizing happen in one action.
Visibility follows **source access**: anyone who can reach the query’s source (through any team they belong to) can see and run it. Editing is more restricted; see [Who can edit](#who-can-edit-a-query).
## Collections
[Section titled “Collections”](#collections)
A collection is a curated list of saved queries with its own members.
* **Personal collection**: every user has one, created automatically. It’s private and can’t be shared, renamed, or deleted. Think of it as your bookmarks.
* **Shared collections**: anyone can create one. You become its owner and can invite teammates or share it with whole teams. Use them for on-call runbooks, incident playbooks, or a team’s go-to queries.
Create a collection with **New** in the Library rail, then **Invite** teammates or **Share with team**, and pin queries to it.
## Roles
[Section titled “Roles”](#roles)
Shared collections have three roles:
| Role | Read & run | Add/remove items | Edit the queries | Manage members and teams | Delete collection |
| ---------- | ---------- | ---------------- | ---------------- | ------------------------ | ----------------- |
| **Member** | ✓ | ✓ | — | — | — |
| **Editor** | ✓ | ✓ | ✓ | — | — |
| **Owner** | ✓ | ✓ | ✓ | ✓ | ✓ |
Running, pinning, and editing always also require **source access**: a role in a collection never grants access to the underlying logs. A query you can’t run shows with a lock icon. Removing an item from a collection needs no source access, so participants can unpin a locked query.
## Share with a team
[Section titled “Share with a team”](#share-with-a-team)
Owners can share a collection with a whole team instead of inviting people one by one. Open the collection and choose **Share with team**.
* **Every current member of the team** sees the collection with the **Member** role. This includes team admins and editors: a team share never grants Editor or Owner rights. To give someone more, invite them directly; a direct role always takes precedence.
* **Membership is live.** People who join the team see the collection on their next request. People who leave the team lose it, unless they are direct members or belong to another shared team.
* **No source access is granted.** A team share controls who sees the collection, not who can read logs. Each person runs only the queries whose sources their own teams can reach; the other items show with a lock icon, and the server rejects any attempt to run them.
* **Which teams you can pick:** owners can share with teams they belong to. Global admins can share their own collections with any team. Being a global admin does not let you manage someone else’s collection. OAuth tokens are read-only and cannot change shares. The global admin role does not apply through OAuth, so only collection owners can read the member and team lists with those tokens.
* **Removing a share** affects only that team. Direct members and other shared teams keep access. Owners can remove a share even after they leave the team. Deleting a team removes its shares automatically.
* Personal collections can’t be shared with teams.
The member count shows direct members only (owners included); shared teams are listed and counted separately. Only owners see the member and team lists. A global admin sees them only when they also participate in the collection, directly or through a shared team, and still needs to be an owner to change them. Other members and editors don’t see either list. Leaving a collection removes your direct membership only; you keep access through a shared team until you leave that team or the owner removes the share.
## Who can edit a query
[Section titled “Who can edit a query”](#who-can-edit-a-query)
A saved query can be edited by:
1. its **creator**,
2. a **global admin**, or
3. an **owner or editor** of a shared collection that contains it (still requiring source access).
Because a saved query is a single shared row, **editing it changes it everywhere it appears**, in every collection and for every viewer. To make a variant instead of changing the shared one, save a new query rather than editing.
Deleting a query is more restricted than editing: only the **creator** or a **global admin** can delete it, since deletion removes it from every collection at once.
## Common workflows
[Section titled “Common workflows”](#common-workflows)
**Share a team’s go-to queries**
1. **New** → name the collection (e.g. “Payments on-call”).
2. **Share with team** to give the whole team read & run access, or **Invite** individuals as Members (read & run) or Editors (can also refine the queries).
3. Open each query in the explorer and **Save** it into the collection.
**Hand a query to a teammate to maintain**
Add them to a shared collection containing the query as an **Editor**. They can now open it, change it, and re-save without needing global-admin rights.
## Next steps
[Section titled “Next steps”](#next-steps)
* Run saved queries from the terminal with the [CLI’s `collections` command](/integration/cli/#collections)
* See [Query Examples](/guide/examples) for LogchefQL patterns worth saving
* Pin a saved query’s results to a [Dashboard](/features/dashboards) panel
# Dashboards
> Build multi-panel Logchef dashboards that group log-query visualizations into a shared grid with one time range and auto-refresh.
A dashboard is a grid of panels, each one a query rendered as a visualization, sharing one time range and refreshing together. Use them for the views you keep coming back to: an error overview, a service’s request rate, the count of 5xx responses right now. There’s no configuration or external tooling to set up; dashboards live entirely inside Logchef.
Open **Dashboards** from the sidebar to see every dashboard, then open one to view its panels.
## Concept
[Section titled “Concept”](#concept)
A dashboard holds a set of **panels** laid out on a 12-column grid. Each panel is a self-contained visualization: it points at a team and source, carries its own query (LogchefQL, or native LogsQL for a VictoriaLogs source), and renders as one of the panel types below. Panels do not share a query, only the dashboard’s time range and refresh interval.
Panels run through the same team-scoped query endpoints the explorer uses, so a dashboard adds no new way to reach log data: whatever a viewer can query in the explorer, they can see in a panel.
## Panel types
[Section titled “Panel types”](#panel-types)
* **Time series**: a chart over time, using the same histogram data the explorer draws. You can render it as a line, area, or bars (stacked or grouped), and optionally group by a field to break the series out (for example, 5xx responses split by service).
* **Stat**: a single number: the total match count for the query over the current time range. Good for “how many errors in the last 15 minutes”.
* **Breakdown**: log counts by a required field over the selected range. Use horizontal bars (default) or a donut for a compact top-category view.
* **Table**: the matching rows, like the explorer results grid. Set a row limit and an optional column subset.
Time series, stat, and breakdown panels all use the source’s histogram endpoint. For native VictoriaLogs panels, write the filter portion of LogsQL: VictoriaLogs’ hits API ignores pipes while building histogram data. Table panels execute the full LogsQL query and can use pipes such as `fields` and `unpack_json`.
Grouped histograms return the top 10 series and combine any remaining series into an **other** bucket. Prefer fields such as service, environment, host, or severity over high-cardinality request and trace IDs.
### Multiple data sources
[Section titled “Multiple data sources”](#multiple-data-sources)
Each panel picks its own team and source, so a single dashboard can mix panels from different backends: a ClickHouse time series next to a VictoriaLogs stat. LogchefQL compiles to whatever the panel’s source speaks, so the same filter works across backends. The panel builder also offers a native LogsQL toggle when a VictoriaLogs source is selected. Native ClickHouse SQL is not exposed in the dashboard panel builder in this release; use LogchefQL for ClickHouse panels.
If a viewer lacks access to a panel’s source, that panel renders a locked state while the rest of the dashboard loads normally, the same pattern used for shared collection items.
## Build a VictoriaLogs overview
[Section titled “Build a VictoriaLogs overview”](#build-a-victorialogs-overview)
After connecting a VictoriaLogs source, a compact service-health dashboard is a good way to see the four panel types together:
1. Open **Dashboards**, choose **New dashboard**, name it, and open it.
2. Choose **Edit**, then **Add panel**.
3. Add a **Stat** panel for `level="error"` to show the current error count.
4. Add a **Time series** panel for `env="prod"`, grouped by `service`, to show which service is driving volume.
5. Add a **Breakdown** panel for `env="prod"`, grouped by `level`, and choose horizontal bars or a donut.
6. Add a **Table** panel for `level="error"`, keep its row limit small, and pick the columns responders need first.
7. Resize and arrange the panels, then choose **Save**.
All four panels follow the dashboard time picker. You can switch an individual VictoriaLogs panel to native LogsQL without changing the other panels or the dashboard’s backend mix.
## Time range and refresh
[Section titled “Time range and refresh”](#time-range-and-refresh)
Every panel on a dashboard shares one **time range**, set from the toolbar (the same quick and absolute ranges as the explorer). Changing it re-runs all panels. New dashboards default to the last 15 minutes.
Set an **auto-refresh** interval (off, 30 seconds, 1 minute, or 5 minutes) to keep a wall-board style view current. There is also a manual refresh button.
Panels render correctly for viewers in any timezone: histogram buckets (time series panels) align to your local timezone, while table and stat panels use a UTC-anchored query internally so their time window doesn’t shift for non-UTC viewers.
## Result caching
[Section titled “Result caching”](#result-caching)
Because every panel re-runs on each refresh, a busy dashboard can hammer the backend: *N* panels open by *M* viewers is up to *N×M* queries per refresh cycle. Each dashboard has a **cache TTL** in its settings (default 10 minutes) that turns on a shared, server-side result cache. The first viewer’s query fills the cache and everyone else within that window is served the stored result, so a panel hits the backend at most once per TTL. Set the TTL to `0` to disable caching for that dashboard and always query live.
The cache covers dashboard panels only — explorer and other ad-hoc queries are never cached. Server-wide limits (total size, per-entry cap, entry count) are set with the [`[dashboard_cache]` config](/getting-started/configuration/#dashboard-result-cache).
## Chart styles
[Section titled “Chart styles”](#chart-styles)
Time series panels can render as **line** (default), **area**, or **bars**. Set the style per panel in the panel builder. When the style is bars, you can choose **stacked** (default) or **grouped** bar mode. The histogram data is shared with the explorer, including zero-filled gaps, so a sparse or grouped series (e.g. 5xx errors by host) renders as a continuous chart instead of isolated bars floating over dead space.
## Editing
[Section titled “Editing”](#editing)
Open a dashboard and choose **Edit** to enter a direct-manipulation canvas:
* **Move a panel**: drag it by its header to a new grid position.
* **Resize a panel**: drag the handle on its bottom-right corner.
* **Add a panel**: click an empty grid slot, or the “+ Add panel” tile. This opens the **panel builder**, a full-height drawer where you pick the team and source, write the query in the Monaco editor (LogchefQL, or LogsQL for VictoriaLogs) with a live preview, choose the panel type, and set type-specific options: group-by and chart style for time series, a required group-by and horizontal-bar or donut view for breakdowns, and a row limit and optional column subset for tables.
* **Edit or remove** an existing panel via the pencil / trash icons on its header, which reopens the same panel builder drawer.
Changes stay local until you **Save**; **Cancel** discards them. Leaving with unsaved edits prompts first.
A dashboard can contain up to 24 panels.
## Who can edit
[Section titled “Who can edit”](#who-can-edit)
* **Anyone signed in** can list and view dashboards.
* **The creator** and **global admins** can edit and delete a dashboard.
Per-dashboard sharing roles are not part of this release. As always, viewing a panel never grants access to its underlying source; source access is enforced when the panel’s query runs.
## No configuration needed
[Section titled “No configuration needed”](#no-configuration-needed)
Dashboards ship with Logchef. You don’t need to enable anything in config or run an extra service: dashboard definitions are saved in Logchef’s metadata store, right alongside your teams, sources, and saved queries.
## Next steps
[Section titled “Next steps”](#next-steps)
* Save the queries behind your panels to a [Collection](/features/collections) so teammates can reuse them
* Review [Search Syntax](/guide/search-syntax) to write the LogchefQL filters panels use
* See [Alerting](/features/alerting) to get notified instead of watching a dashboard
# Field Values Sidebar
> Explore field values and quickly filter logs with the Kibana-inspired sidebar
The Field Values Sidebar is a Kibana-inspired field exploration panel for discovering and filtering log data quickly. It shows available fields and their top distinct values, so you can see what’s in your data and build queries from it.
## Overview
[Section titled “Overview”](#overview)
The sidebar appears on the left side of the query interface and shows:
* Queryable fields discovered from your current source
* Top 10 unique values for each field with occurrence counts
* Quick-filter buttons to add or exclude values from your query
## Using the Sidebar
[Section titled “Using the Sidebar”](#using-the-sidebar)
### Viewing Field Values
[Section titled “Viewing Field Values”](#viewing-field-values)
Click on any field name to expand it and see its top values. Each value shows:
* The actual value
* How many times it appears in the current time range
### Filtering by Value
[Section titled “Filtering by Value”](#filtering-by-value)
* **Click a value** to add it as a filter: `field="value"`
* **Alt/Option+click a value** to exclude it: `field!="value"`
The filter is automatically added to your LogchefQL query, and results update immediately.
## Field Loading Behavior
[Section titled “Field Loading Behavior”](#field-loading-behavior)
The sidebar uses a hybrid loading strategy to balance responsiveness with query performance:
### Auto-Loaded Fields
[Section titled “Auto-Loaded Fields”](#auto-loaded-fields)
For ClickHouse, **LowCardinality** and **Enum** columns load their values automatically when you open the sidebar. These column types are optimized for distinct value queries and return quickly.
### On-Demand Fields
[Section titled “On-Demand Fields”](#on-demand-fields)
For ClickHouse, **String** columns require a click to load their values. This prevents slow queries on high-cardinality fields (like request IDs or timestamps) that could have millions of unique values.
For VictoriaLogs, fields are discovered dynamically for the selected time range and values are fetched on demand.
### Auto-Expand Behavior
[Section titled “Auto-Expand Behavior”](#auto-expand-behavior)
Fields with 6 or fewer distinct values automatically expand to show all values. This gives you quick access to common filter targets like log levels (`debug`, `info`, `warn`, `error`) without extra clicks.
### Value Count Badges
[Section titled “Value Count Badges”](#value-count-badges)
Collapsed fields display a badge showing the total number of distinct values, helping you identify high vs. low cardinality fields at a glance.
## Time Range and Query Integration
[Section titled “Time Range and Query Integration”](#time-range-and-query-integration)
The sidebar is context-aware and integrates with your current view:
### Time Range
[Section titled “Time Range”](#time-range)
Values and counts reflect only the selected time range. If you’re looking at the last 15 minutes, you’ll see values that appeared in that window, not historical data.
### Active Query Filtering
[Section titled “Active Query Filtering”](#active-query-filtering)
When you have an active LogchefQL query, the sidebar shows only values that match your current filters. For example, if your query is `level="error"`, the sidebar values for other fields show only what appears in error logs.
### Auto-Refresh
[Section titled “Auto-Refresh”](#auto-refresh)
The sidebar automatically updates when you run a query, keeping values in sync with your current view.
## Error Handling
[Section titled “Error Handling”](#error-handling)
The sidebar handles errors gracefully:
* **Per-field errors**: If one field fails to load, other fields continue working normally
* **Retry button**: Failed fields show a retry button to attempt loading again
* **Progressive loading**: Values load in parallel (up to 4 concurrent requests) for faster initial display
## Supported Field Types
[Section titled “Supported Field Types”](#supported-field-types)
The sidebar behavior depends on the datasource:
### ClickHouse
[Section titled “ClickHouse”](#clickhouse)
| Column Type | Loading | Notes |
| -------------- | --------- | ---------------------------------------------------- |
| LowCardinality | Auto | Optimized for distinct queries |
| Enum | Auto | Fast enumeration of possible values |
| String | On-demand | Click to load (avoids slow high-cardinality queries) |
Complex types like Map, Array, Tuple, and JSON are excluded since they don’t have simple distinct values.
### VictoriaLogs
[Section titled “VictoriaLogs”](#victorialogs)
* Fields are discovered dynamically rather than read from a fixed SQL schema
* Value lookups are time-range-aware
* Internal fields such as `_stream` and `_stream_id` may exist, but Logchef hides noisy defaults in the main table view
## Tips
[Section titled “Tips”](#tips)
1. **Use for exploration**: When investigating unfamiliar data, expand fields to discover what values exist
2. **Build queries visually**: Click through values to construct LogchefQL filters without typing
3. **Identify patterns**: High occurrence counts reveal common values; low counts may indicate anomalies
4. **Narrow first**: Apply time range and basic filters before loading String field values to get faster, more relevant results
## Next steps
[Section titled “Next steps”](#next-steps)
* Learn the filters the sidebar writes for you in [Search Syntax](/guide/search-syntax)
* See [Query Examples](/guide/examples) for more LogchefQL patterns
* Review the [Query Interface](/user-guide/query-interface) for the rest of the explorer
# Service Tokens
> Non-login service accounts with scoped API tokens for automation and CI: add them to teams and control which sources and actions each token can access.
Logchef separates **service accounts** (non-login principals) from human users and lets you issue **scoped API tokens** for each one. Use them for log shippers, CI checks, dashboards, alert pipelines, or any automation that needs read or write access without a real person behind it.
A service account never logs in via OIDC. It exists only to own tokens and appear as a team member.
## Concepts
[Section titled “Concepts”](#concepts)
**Two independent axes of access:**
| Axis | Granted by | Enforced by |
| ------------------------ | --------------------------------- | ------------------------------------------- |
| **Token scopes** | scope picker when issuing a token | `requireTokenScope(...)` middleware |
| **Team / source access** | adding the account to a team | `requireTeamMember`, `requireTeamHasSource` |
Both must pass for a call to succeed. A read-only token in zero teams will authenticate but every `/teams/:id/sources/...` route returns 403. Conversely, adding the account to every team without granting `logs:read` on the token also yields 403. Pick the narrowest token scopes and the smallest set of teams that let the automation do its job.
## Create a service account
[Section titled “Create a service account”](#create-a-service-account)
1. **Administration → Service Tokens → Create service account**
2. Give it a name (e.g. `ci-log-checker`, `grafana-pipeline`).
The account is created as `member` role with `account_type = service`. It cannot log in. The generated email (`svc-@service.logchef.internal`) is an internal placeholder; the name is what shows up in team member lists.
## Add it to teams
[Section titled “Add it to teams”](#add-it-to-teams)
A service account on its own can hit `/me`, `/me/tokens`, and any admin endpoint if its tokens carry the right scopes, but **source-scoped routes require team membership**.
From the **Service Tokens** page, click **Manage teams** on the account card. Pick the teams whose sources the automation needs, set role to **Member** (matches a read-only token’s expectations), and add.
You can also add a service account from the normal **Admin → Teams → Add Member** dialog. Switch the dialog’s “Account type” toggle to **Service account** and the picker filters to service principals only.
## Issue a token
[Section titled “Issue a token”](#issue-a-token)
1. **Service Tokens → Create token** on the account card
2. Pick an expiration: 7 / 30 / 90 days or never
3. Pick scopes: choose a preset or hand-pick
### Scope presets
[Section titled “Scope presets”](#scope-presets)
| Preset | Scopes | Use case |
| ------------------ | ------------------------------------------------------------------------------------- | ------------------------------------------------- |
| **Read-only** | every `:read` scope | Default for log shippers, dashboards, audit tools |
| **Logs viewer** | `profile:read`, `sources:read`, `logs:read`, `saved_queries:read`, `collections:read` | Smallest footprint for “just run queries” |
| **Logs analyst** | Logs viewer + `saved_queries:write`, `collections:write`, `query_shares:*` | Read logs and save/share queries |
| **Alerts manager** | `alerts:*`, `logs:read`, `sources:read`, `saved_queries:read`, `profile:read` | Manage alert definitions end-to-end |
| **Source admin** | `sources:*`, `settings:read`, `profile:read` | Provision/update sources |
| **Full access** | `*` | Equivalent to a logged-in session; last resort |
You can deviate from any preset by toggling individual scopes after picking one. The active preset stays highlighted while the selection matches; once you customize, it falls back to a scope count badge.
The token is shown **exactly once**. Copy it before closing the dialog. If lost, delete and reissue.
## Using a token
[Section titled “Using a token”](#using-a-token)
Pass it as a bearer header on any API call:
```bash
TOKEN='logchef__<32-hex>'
BASE='https://logchef.example.com/api/v1'
# Sanity check — should return the service account's user record
curl -sS -H "Authorization: Bearer $TOKEN" "$BASE/me"
# List teams the account belongs to
curl -sS -H "Authorization: Bearer $TOKEN" "$BASE/me/teams"
# Run a LogchefQL query
curl -sS -X POST \
-H "Authorization: Bearer $TOKEN" \
-H "Content-Type: application/json" \
"$BASE/teams/8/sources/11/logchefql/query" \
-d '{
"query": "level=\"error\"",
"limit": 100,
"start_time": "2026-05-19T00:00:00Z",
"end_time": "2026-05-19T23:59:59Z"
}'
# Raw SQL
curl -sS -X POST \
-H "Authorization: Bearer $TOKEN" \
-H "Content-Type: application/json" \
"$BASE/teams/8/sources/11/logs/query" \
-d '{"raw_sql":"SELECT timestamp, message FROM logs.app WHERE level='\''error'\'' LIMIT 50"}'
```
## Failure modes
[Section titled “Failure modes”](#failure-modes)
| Symptom | Cause | Fix |
| ------------------------------------------------------ | ------------------------------------------------------- | ----------------------------------------------------- |
| `401 Invalid or expired token` | Token revoked, expired, or wrong value | Check `Service Tokens` page; reissue if needed |
| `403 API token does not have the required scope` | Token is missing the scope the route requires | Reissue with the right preset or add specific scopes |
| `403 Team membership required` | Service account is not in the team owning the source | **Manage teams** on the account card; add to the team |
| `404` on `/admin/users/` | Service accounts are managed via the dedicated endpoint | Use `/admin/service-accounts/` |
| All teams listed for the account but queries still 403 | Token scope does not include `logs:read` | Reissue with Read-only or Logs viewer preset |
## Revoking access
[Section titled “Revoking access”](#revoking-access)
* **Revoke a single token**: Service Tokens page → token row → trash icon.
* **Revoke everything for an account**: delete the service account. All of its tokens and team memberships go with it.
* **Reduce blast radius without deleting**: remove the account from specific teams using **Manage teams**.
A revoked or deleted token starts returning `401` immediately on the next request. There’s no cache and no grace period.
## Service accounts vs human accounts
[Section titled “Service accounts vs human accounts”](#service-accounts-vs-human-accounts)
| | Human user | Service account |
| ------------------------------ | ----------------------------------------- | ----------------------------------------- |
| Logs in via OIDC | Yes | No, rejected at OIDC callback |
| Owns sessions (cookies) | Yes | No |
| Owns API tokens | Yes (issued from `Settings → API Tokens`) | Yes (issued from `Service Tokens`) |
| Appears in `/admin/users` | Yes | No, managed via `/admin/service-accounts` |
| Appears in team member pickers | Yes (in **Human user** mode) | Yes (in **Service account** mode) |
| Default token scope | Full access (session-equivalent) | Read-only preset |
| Visual indicator in team list | None | `Service account` badge + bot icon |
## Best practices
[Section titled “Best practices”](#best-practices)
* **One service account per workload.** Easier to audit, easier to rotate.
* **Match team role to broadest scope you might issue.** If a service account may eventually need `saved_queries:write`, give it the Editor team role; for pure read tokens, Member is fine. Mismatched role and scope is safe (strictest layer wins) but confusing for future readers.
* **Prefer short-lived tokens.** 30 days is the default in the UI; renew on a schedule rather than minting “never expires” tokens.
* **Keep `tokens:write` off automation tokens.** A token with `tokens:write` can mint more tokens for itself. That’s only useful for orchestration that intentionally rotates tokens.
## Next steps
[Section titled “Next steps”](#next-steps)
* Use a token with the [CLI](/integration/cli/#api-token-authentication) for scripted queries
* Review [Declarative Provisioning](/getting-started/provisioning) to manage teams and sources as code
# Configuration
> Configure Logchef's server, authentication, and runtime settings using a TOML file and LOGCHEF_ environment variable overrides.
Logchef uses a minimal TOML configuration file for bootstrap settings, with runtime configuration managed through the Admin Settings UI. This guide explains the essential configuration options and how to manage non-essential settings through the web interface.
## Configuration Architecture
[Section titled “Configuration Architecture”](#configuration-architecture)
Logchef separates configuration into two categories:
**Essential (Bootstrap) Settings** - Required in `config.toml`:
* Server connection details (port, host)
* SQLite database path
* OIDC authentication credentials
* Admin user emails and API token secrets
* Logging configuration
**Runtime Settings** - Managed via Admin Settings UI:
* Alerting configuration (SMTP settings, intervals, timeouts)
* AI/LLM settings (API keys, models, endpoints)
* Session management (duration, concurrency)
* Frontend URL (public URL of the web UI)
On first boot, Logchef seeds the database with values from `config.toml`. After that, runtime settings are stored in the database and managed through the Admin Settings UI at **Administration → System Settings**.
## Essential Configuration
[Section titled “Essential Configuration”](#essential-configuration)
These settings must be present in `config.toml` for Logchef to start:
## Server Settings
[Section titled “Server Settings”](#server-settings)
Configure the HTTP server and frontend settings:
```toml
[server]
# Port for the HTTP server (default: 8125)
port = 8125
# Host address to bind to (default: "0.0.0.0")
host = "0.0.0.0"
# Public URL of the web UI, e.g. "https://logs.example.com". Used for login
# redirects and share links. To serve Logchef under a subpath, include it:
# "https://example.com/logchef". See Operations → Reverse Proxy.
frontend_url = ""
# HTTP server timeout for requests (default: 30s)
http_server_timeout = "30s"
# Trusted reverse-proxy IPs/CIDRs for client-IP resolution. Empty (default)
# trusts no proxy — the client IP is the direct connection peer. Set to your
# reverse proxy's address(es) to resolve the real client from proxy_header.
trusted_proxies = []
# Forwarding header read for the client IP, ONLY when the direct peer is one of
# trusted_proxies (otherwise ignored, so untrusted callers can't spoof it).
proxy_header = "X-Forwarded-For"
# Canonical external origin of this instance, for example
# "https://logs.example.com". Required when [auth.oauth] is enabled.
# Origin only: scheme, host, and optional port. No path, no trailing slash.
# Must be https, except on localhost, 127.0.0.1, or ::1.
public_url = ""
# Origin that browsers use for the OAuth sign-in pages, when it differs from
# public_url. Optional. Same rules as public_url. Unset means public_url.
browser_url = ""
```
`public_url` is separate from `frontend_url`. `frontend_url` builds links in the UI and can include a subpath. `public_url` is the OAuth issuer. [Logchef OAuth](#logchef-oauth) does not work under a subpath.
Client IP behind a proxy
`trusted_proxies` is what lets client-IP features (e.g. per-IP rate limiting) work behind a reverse proxy. List only your proxy’s own address(es), and make sure that proxy **overwrites** the forwarding header rather than appending a client-supplied one — otherwise the client IP can be spoofed. Invalid entries or a `0.0.0.0/0` wildcard fail startup.
To run Logchef under a subpath such as `https://example.com/logchef/`, refer to [Reverse Proxy](/operations/reverse-proxy#under-a-subpath).
## Database Configuration
[Section titled “Database Configuration”](#database-configuration)
SQLite database settings for storing metadata:
```toml
[sqlite]
# Path to the SQLite database file
path = "logchef.db"
```
## Authentication
[Section titled “Authentication”](#authentication)
### OpenID Connect (OIDC)
[Section titled “OpenID Connect (OIDC)”](#openid-connect-oidc)
Configure your SSO provider (example using Dex):
```toml
[oidc]
# URL of your OIDC provider
provider_url = "http://dex:5556/dex"
# Authentication endpoint URL (Optional: often discovered via provider_url)
auth_url = "http://dex:5556/dex/auth"
# Token endpoint URL (Optional: often discovered via provider_url)
token_url = "http://dex:5556/dex/token"
# OIDC client credentials
client_id = "logchef"
client_secret = "logchef-secret"
# Callback URL for OIDC authentication
# Must match the URL configured in your OIDC provider
redirect_url = "http://localhost:8125/api/v1/auth/callback"
# Required OIDC scopes
scopes = ["openid", "email", "profile"]
# Keep false unless your OIDC provider omits email_verified while verifying
# email addresses by other means. Missing/null email_verified is allowed only
# when this is true; explicit email_verified=false is always rejected.
skip_email_verified_check = false
```
`oidc.skip_email_verified_check` is useful for providers such as Cloudflare Access that do not emit the `email_verified` claim. It does not bypass an explicit `email_verified=false` response.
### Logchef OAuth
[Section titled “Logchef OAuth”](#logchef-oauth)
Logchef OAuth lets the [Logchef CLI](/integration/cli) and AI assistants sign in with a browser consent, instead of a copied API token. The same server also serves the [MCP endpoint](/integration/mcp-server) at `/mcp`. OAuth is **off by default**. When it is off, no OAuth route, metadata, or `/mcp` endpoint exists.
Users still sign in to Logchef with OIDC or local login. OAuth adds a consent step on top. Logchef OAuth does not replace your SSO provider.
To enable it, set `server.public_url` and turn on `auth.oauth`:
```toml
[server]
public_url = "https://logchef.example.com"
[auth.oauth]
enabled = true
```
Environment variables: `LOGCHEF_SERVER__PUBLIC_URL`, `LOGCHEF_AUTH__OAUTH__ENABLED=true`.
When OAuth is off, `/mcp` and every unknown `/.well-known/*` path return `404`.
Logchef refuses to start when OAuth is on and `public_url` is missing or invalid. It must be an origin with `https`. Plain `http` is allowed only for `localhost`, `127.0.0.1`, and `::1`. A path (a subpath deployment) is not supported with OAuth. Set `public_url` to the address that users and agents type in a browser or an MCP client. A mismatch makes sign-in fail, because the issuer must equal the address the client uses. If browsers and agents use different hosts, refer to [Split deployments](#split-deployments).
Behind a reverse proxy, the proxy must forward `/oauth/*`, `/.well-known/oauth-*`, and `/mcp` to Logchef. Refer to [Reverse Proxy](/operations/reverse-proxy).
#### Built-in clients
[Section titled “Built-in clients”](#built-in-clients)
Two clients are built in. You do not configure them.
| Client ID | For | Tokens work at | Callback |
| ------------- | ---------------------------------- | -------------- | ----------------------------------------------------------- |
| `logchef-cli` | The Logchef CLI | `/api` | `http://127.0.0.1:/callback` |
| `logchef-mcp` | Claude Code, Codex, Cursor desktop | `/mcp` | `http://localhost:/callback`, `127.0.0.1`, or `[::1]` |
You cannot reuse these IDs in your own client list.
#### Hosted clients
[Section titled “Hosted clients”](#hosted-clients)
A hosted assistant, such as Claude.ai or ChatGPT, runs in a vendor’s cloud. It cannot use a loopback callback. Add one `[[auth.oauth.clients]]` entry for each host, with the exact callback URL:
```toml
[[auth.oauth.clients]]
id = "claude"
name = "Claude"
redirect_uris = ["https://claude.ai/api/mcp/auth_callback"]
[[auth.oauth.clients]]
id = "chatgpt"
name = "ChatGPT"
redirect_uris = ["https://chatgpt.com/connector_platform_oauth_redirect"]
[[auth.oauth.clients]]
id = "cursor-web"
name = "Cursor"
redirect_uris = ["https://www.cursor.com/agents/mcp/oauth/callback"]
```
| Setting | Description |
| --------------- | ------------------------------------------------------------------------------------------------ |
| `id` | Client ID that you enter in the host. Must be unique. Cannot be `logchef-cli` or `logchef-mcp`. |
| `name` | Name shown on the consent page. |
| `redirect_uris` | Exact callback URLs. Each must be an absolute `https` URL without a fragment. Matching is exact. |
Hosted clients are public clients. They use PKCE, and they have no client secret. They can get tokens for `/mcp` only. Refer to [Agent Setup](/integration/agent-setup) for the host-side steps.
To let a browser-based MCP tool call `/mcp` from another origin, list that origin in `auth.oauth.mcp_allowed_origins`. Requests with no `Origin` header, such as those from desktop clients, are always allowed.
```toml
[auth.oauth]
enabled = true
mcp_allowed_origins = ["https://inspector.example.com"]
```
#### Split deployments
[Section titled “Split deployments”](#split-deployments)
Some deployments put the web UI behind an SSO proxy, and serve the API on a second host that CLIs and agents reach directly. Set `server.browser_url` for this case:
```toml
[server]
# Issuer and machine origin: metadata, token, revocation, /mcp, and the "iss" value.
public_url = "https://logchef-api.example.com"
# Browser origin: authorize, consent, and connected apps.
browser_url = "https://logchef.example.com"
# The web UI, the OIDC login callback, and the session cookie stay on the UI host.
frontend_url = "https://logchef.example.com"
[auth.oauth]
enabled = true
```
Environment variables: `LOGCHEF_SERVER__PUBLIC_URL`, `LOGCHEF_SERVER__BROWSER_URL`.
| Item | Host |
| ----------------------------------------------------------------------------------------------------------------- | ----------------------- |
| Issuer, `iss` on every redirect, token endpoint, revocation endpoint, protected resource metadata, `/mcp`, `/api` | `public_url` (API host) |
| `authorization_endpoint` in the metadata, the consent page, Settings → Connected apps | `browser_url` (UI host) |
`browser_url` must follow the same rules as `public_url`: an origin only, with `https` (or `http` on a loopback host). Logchef checks it only when OAuth is enabled. If `browser_url` is unset, one host serves everything, and `public_url` is used for the browser pages too.
The user’s browser goes to the UI host to sign in and approve. The CLI or agent talks to the API host for tokens and tool calls. A request for `/oauth/authorize` on the API host is answered with a redirect to the consent page on the UI host. For the paths that each host must pass, refer to [Reverse Proxy](/operations/reverse-proxy#split-ui-and-api-hosts).
#### What users can do
[Section titled “What users can do”](#what-users-can-do)
* Each agent connection shows in **Settings → Connected apps**, where the user can revoke it.
* Access tokens last 10 minutes. Refresh tokens last 30 days.
* OAuth tokens carry read scopes only. They cannot change data or reach admin routes, even for an admin user. They see only the teams the user belongs to.
#### Local development
[Section titled “Local development”](#local-development)
To test OAuth with the Vite dev server, set `public_url` to the Vite address. The dev server proxies the OAuth endpoints and metadata to the backend, so the issuer, the consent page, and the browser origin all match.
```toml
[server]
public_url = "http://localhost:5173"
[auth.oauth]
enabled = true
```
Without Vite, build the UI with `just build`, and set `public_url` to the backend address, for example `http://localhost:8125`.
### Local authentication (run without OIDC)
[Section titled “Local authentication (run without OIDC)”](#local-authentication-run-without-oidc)
Logchef can run without an external identity provider. Enable built-in email+password authentication and bootstrap an admin at startup:
```toml
[auth.local]
enabled = true
admin_email = "admin@example.com"
# Prefer the environment variable below over committing a password to a file.
# Minimum 10 characters. Stored as a bcrypt hash; the plaintext is never logged.
admin_password = "change-me-please"
```
Or via environment variables:
```bash
LOGCHEF_AUTH__LOCAL__ENABLED=true
LOGCHEF_AUTH__LOCAL__ADMIN_EMAIL=admin@example.com
LOGCHEF_AUTH__LOCAL__ADMIN_PASSWORD=change-me-please
```
When local auth is enabled the whole `[oidc]` section becomes optional. The login page shows an email/password form (and the SSO button too, if OIDC is also configured). The bootstrap admin is created (or its password updated) on every startup, so rotating the password is just a config change + restart. The login endpoint is rate limited per IP and per email.
### SSO auto-provisioning (JIT user creation)
[Section titled “SSO auto-provisioning (JIT user creation)”](#sso-auto-provisioning-jit-user-creation)
By default, an OIDC login from a user who doesn’t already exist in Logchef is rejected with “user not found”: someone has to create the user first (via the admin UI or [declarative provisioning](/getting-started/provisioning/)). **Auto-provisioning** removes that step for your own company domain: a first-time OIDC login from an allowed email domain creates the user on the spot.
```toml
[auth.auto_provision]
# Off by default.
enabled = true
# Email domains eligible for auto-provisioning. Matching is an exact,
# case-insensitive comparison against the domain part of the OIDC email
# claim — no subdomain or wildcard matching. Required (non-empty) when enabled;
# startup fails otherwise.
allowed_domains = ["example.com"]
# Optional: team IDs the new user is added to, as role "member". Best-effort —
# a nonexistent team ID is logged and skipped, it never fails the login.
default_team_ids = [1]
```
Or via environment variables:
```bash
LOGCHEF_AUTH__AUTO_PROVISION__ENABLED=true
LOGCHEF_AUTH__AUTO_PROVISION__ALLOWED_DOMAINS="example.com"
LOGCHEF_AUTH__AUTO_PROVISION__DEFAULT_TEAM_IDS="1"
```
Behavior notes:
* Auto-provisioned users are always created as regular, active **members**, never admins. Admin access still comes only from `auth.admin_emails`.
* Provisioning runs **after** the `email_verified` claim check, so an unverified email can never mint a user.
* The created users are **unmanaged** with respect to [declarative provisioning](/getting-started/provisioning/): the reconciler never adopts, updates, or prunes them, and admins can edit them freely.
* Applies to the **browser OIDC login** only.
### Auth Settings
[Section titled “Auth Settings”](#auth-settings)
Configure authentication behavior:
```toml
[auth]
# List of email addresses that have admin privileges (required)
admin_emails = ["admin@corp.internal"]
# Secret key for API token hashing (required, min 32 characters)
# Generate with: openssl rand -hex 32
api_token_secret = "your-secret-key-minimum-32-characters-long"
```
**Note:** Session duration, concurrent session limits, and default token expiry are managed via the Admin Settings UI under Authentication settings.
## Logging
[Section titled “Logging”](#logging)
Configure application logging:
```toml
[logging]
# Log level: "debug", "info", "warn", "error"
level = "info"
```
### Query Settings
[Section titled “Query Settings”](#query-settings)
Control interactive query limits separately from streaming downloads.
```toml
[query]
# Browser Run defaults to small previews and caps large responses.
default_preview_limit = 1000
max_preview_limit = 100000
max_response_bytes = 67108864
default_timeout_seconds = 30
max_timeout_seconds = 120
# Whole-call limit for one MCP tool call. Default 60. Capped by max_timeout_seconds.
mcp_call_timeout_seconds = 60
max_concurrent_per_user = 3
max_concurrent_global = 30
[export]
# Download jobs use this separate, higher cap and keep completed artifacts briefly.
max_rows = 1000000
default_timeout_seconds = 120
max_timeout_seconds = 600
max_concurrent_per_user = 1
max_concurrent_global = 5
artifact_ttl = "24h"
formats = ["csv", "ndjson"]
[shares]
default_ttl = "720h"
max_query_text_bytes = 1048576
```
`query.mcp_call_timeout_seconds` ends one whole [MCP](/integration/mcp-server) tool call. It also frees the query slot of a call that a client abandoned. The effective value is never above `query.max_timeout_seconds`. The HTTP API is not affected. Environment variable: `LOGCHEF_QUERY__MCP_CALL_TIMEOUT_SECONDS`.
The UI uses preview limits for Run and export limits for Download.
**Environment variables:** `LOGCHEF_QUERY__MAX_PREVIEW_LIMIT=100000`, `LOGCHEF_EXPORT__MAX_ROWS=1000000`
### Live tail settings
[Section titled “Live tail settings”](#live-tail-settings)
Controls the `/logs/tail` SSE streams that power the explorer’s **Live** toggle. ClickHouse sources are polled every `poll_interval`; VictoriaLogs sources stream natively. The other settings are admission guardrails shared by both backends.
```toml
[tail]
poll_interval = "2s"
max_per_user = 2
max_global = 20
# Kept under [server] http_server_timeout (15m default) — the write deadline
# caps any single response, tails included. Clients re-arm on end.
session_ttl = "14m"
max_rows_per_sec = 100
```
**Environment variables:** `LOGCHEF_TAIL__MAX_PER_USER=4`, `LOGCHEF_TAIL__SESSION_TTL=20m`
### Rate limiting
[Section titled “Rate limiting”](#rate-limiting)
Fixed-window request limits: per-IP (plus an optional global cap) on the unauthenticated auth/token endpoints, and per-user on the query endpoints. **Off by default** — enable it deliberately (see the proxy note below).
```toml
[rate_limit]
enabled = false
auth_per_ip_per_minute = 20 # /auth/login, /auth/callback, /oauth/authorize, /oauth/token, ...
auth_global_per_minute = 300 # 0 disables the global cap
query_per_user_per_minute = 120 # /logs/query, /logs/histogram, field values
```
**Environment variables:** `LOGCHEF_RATE_LIMIT__ENABLED=true`, `LOGCHEF_RATE_LIMIT__AUTH_PER_IP_PER_MINUTE=30`
Rejections return HTTP 429 and increment the `logchef_rate_limit_rejections_total{scope}` metric.
### Public demo read-only mode
[Section titled “Public demo read-only mode”](#public-demo-read-only-mode)
For an internet-facing showcase, Logchef can make its metadata control plane read-only while keeping authentication, source reads, LogchefQL/native queries, histograms, AI query generation, and live exploration available:
```toml
[demo]
read_only = true
```
Or set `LOGCHEF_DEMO__READ_ONLY=true`. The server advertises this mode through `/api/v1/meta`, so the web UI displays a persistent explanation and removes dashboard mutation controls. Blocked metadata writes return HTTP 403 with `error_type: DEMO_INSTANCE`.
For an intentional public demo, `show_login_credentials = true` lets Logchef expose the configured `[auth.local]` email and password through `/api/v1/meta` so the login page can display and prefill them at runtime. You can also set `LOGCHEF_DEMO__SHOW_LOGIN_CREDENTIALS=true`. This option is off by default. **Enabling it publicly exposes the configured local authentication credentials to every visitor**, so never enable it for a normal deployment or with credentials that must remain secret.
```toml
[demo]
read_only = true
show_login_credentials = true
```
Browser-only preferences such as theme, timezone, view mode, and the fields panel remain usable. They are saved to local storage instead of the shared demo account, so one visitor cannot change another visitor’s interface.
Successful queries still increment privacy-safe daily usage and latency aggregates. Raw query text and per-visitor history are neither retained nor returned, including from the admin activity view.
If an internal bootstrap job needs to refresh seeded demo resources after an upgrade, set `LOGCHEF_DEMO__PROVISIONING_TOKEN` and send the same secret in the `X-Logchef-Demo-Provisioning-Token` header. Keep this header private to the internal job; do not add it in a public reverse proxy.
This mode is intended for a shared public demo, not as a substitute for normal role-based access control. Keep datasource credentials read-only and retain reverse-proxy rate limits for public traffic.
### Dashboard result cache
[Section titled “Dashboard result cache”](#dashboard-result-cache)
Dashboards auto-refresh every panel on an interval, so a dashboard with *N* panels open by *M* viewers can generate up to *N×M* backend queries per refresh cycle. A shared, server-side result cache collapses that into one backend hit per panel per TTL window: the first request fills the cache, and every other request in that window is served the stored result.
Caching is **per dashboard**: each dashboard’s TTL lives in its own settings (default 10m; `0` disables caching for that dashboard). Only dashboard panel requests are cached — explorer and other ad-hoc queries are never cached. The `[dashboard_cache]` section sets the server-wide switch and bounds.
```toml
[dashboard_cache]
# Master switch for the per-dashboard result cache.
enabled = true
# Default TTL applied when a dashboard does not set its own (client default mirror).
default_ttl = "10m"
# Hard clamp on any dashboard's requested TTL.
max_ttl = "1h"
# Total encoded bytes held across all cache entries (64 MiB).
max_bytes = 67108864
# Per-response cap; responses larger than this bypass the cache instead of being stored (4 MiB).
max_entry_bytes = 4194304
# Maximum number of cache entries.
max_entries = 1024
# Bounds concurrent distinct datasource fills. Worst-case in-flight buffering is
# max_concurrent_fills × max_entry_bytes.
max_concurrent_fills = 8
```
**Environment variables:** `LOGCHEF_DASHBOARD_CACHE__ENABLED=false`, `LOGCHEF_DASHBOARD_CACHE__MAX_TTL=30m`
Behind a reverse proxy
The per-IP limiter keys on the resolved client IP. Behind a reverse proxy, set `server.trusted_proxies` to the proxy’s exact IP or CIDR and ensure the proxy overwrites `server.proxy_header` (default `X-Forwarded-For`). Logchef ignores the forwarding header from untrusted peers, preventing callers from spoofing their address. Leave per-IP limiting off until trusted-proxy resolution is configured; the global auth cap and per-user query limit remain usable.
## Runtime Configuration (Admin Settings UI)
[Section titled “Runtime Configuration (Admin Settings UI)”](#runtime-configuration-admin-settings-ui)
The following settings are managed through the web interface at **Administration → System Settings** after first boot. You can optionally set initial values in `config.toml` which will be seeded to the database on first boot.
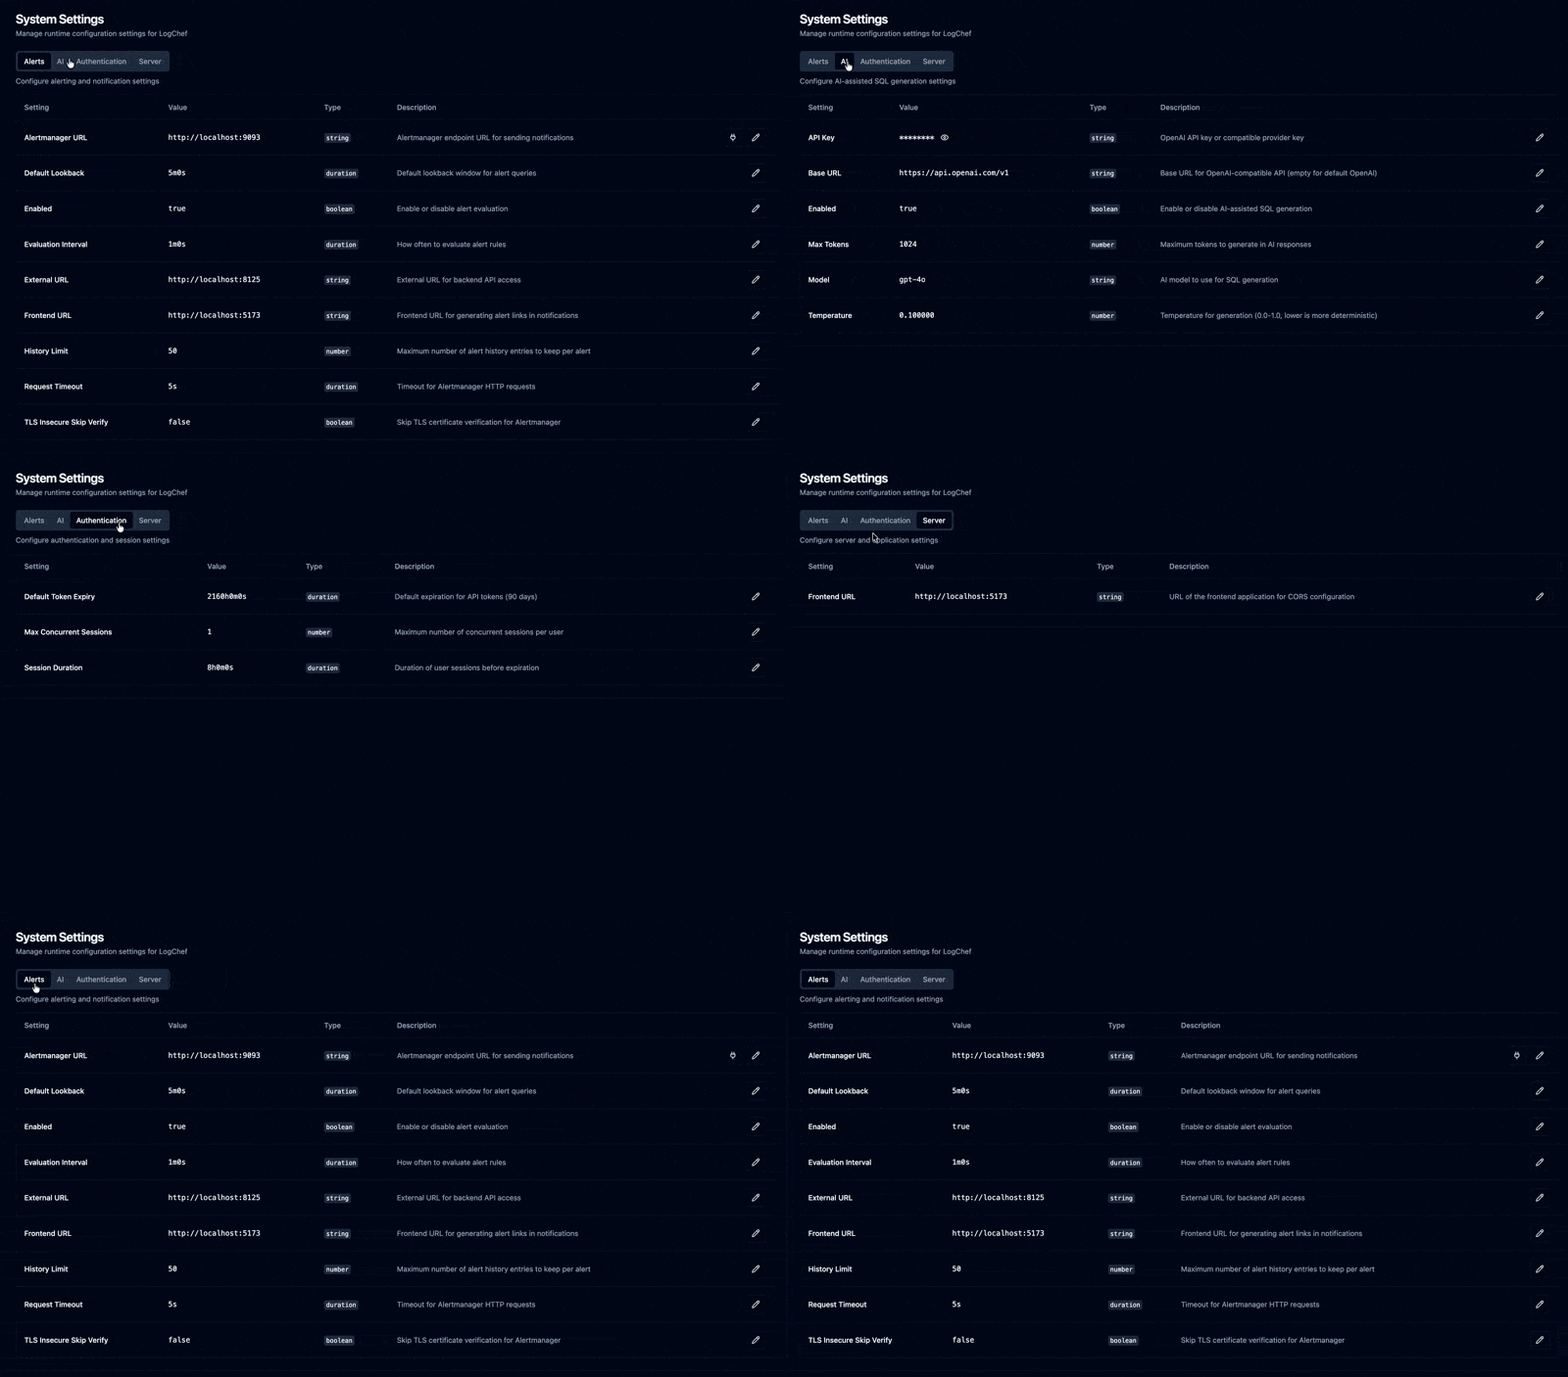
### AI SQL Generation
[Section titled “AI SQL Generation”](#ai-sql-generation)
Configure AI-powered SQL generation through the Admin Settings UI:
**Settings available:**
* **Enabled**: Enable/disable AI features
* **Provider**: AI transport to use — `openai` (default) or `bedrock`
* **Region**: AWS region for the `bedrock` provider (e.g. `us-east-1`); required when `provider = "bedrock"`
* **API Key**: OpenAI API key (marked as sensitive, hidden in UI); used by the `openai` provider
* **Base URL**: OpenAI-compatible API endpoint (default: ); used by the `openai` provider
* **Model**: Model name (e.g., “gpt-4o”, “gpt-4o-mini” for OpenAI; a Bedrock model id / inference-profile ARN such as “anthropic.claude-3-5-sonnet-20241022-v2:0” for Bedrock)
* **Max Tokens**: Maximum tokens to generate (default: 1024)
* **Temperature**: Generation temperature 0.0-1.0 (default: 0.1)
**Supported Providers:**
* **OpenAI** (`provider = "openai"`): Use default base URL ()
* **OpenRouter**: OpenAI provider with base URL set to “”
* **Azure OpenAI**: OpenAI provider pointed at your Azure endpoint
* **Local Models**: OpenAI provider pointed at your local OpenAI-compatible server
* **AWS Bedrock** (`provider = "bedrock"`): Native Bedrock via the unified Converse API. Works across Claude/Llama/Titan/Nova/Mistral. Authenticates through the standard AWS credential chain (environment, shared config, or an IAM role) — no API key is stored in Logchef.
**Optional `config.toml` seeding (first boot only):**
OpenAI (or OpenAI-compatible):
```toml
[ai]
enabled = false
provider = "openai" # default when omitted
base_url = "https://api.openai.com/v1"
api_key = "" # Set via Admin UI after first boot
model = "gpt-4o"
max_tokens = 1024
temperature = 0.1
```
AWS Bedrock (credentials via the AWS chain / IAM role, no api\_key):
```toml
[ai]
enabled = true
provider = "bedrock"
region = "us-east-1"
model = "anthropic.claude-3-5-sonnet-20241022-v2:0"
max_tokens = 1024
temperature = 0.1
```
Reasoning-capable Bedrock models (e.g. `openai.gpt-5.6-*`) accept an optional `reasoning_effort`: `none`, `low`, `medium`, `high`, `xhigh` or `max`. Leave it empty (or omit it) for the model default; other models reject the parameter, so only set it for models that support reasoning. Reasoning tokens count against `max_tokens`, so raise `max_tokens` when using a higher effort — otherwise the model can spend its whole budget thinking and return no query.
```toml
[ai]
enabled = true
provider = "bedrock"
region = "ap-south-1"
model = "in.openai.gpt-5.6-luna"
reasoning_effort = "high"
max_tokens = 4096
```
**Note:** After first boot, changes to `[ai]` section in `config.toml` are ignored. Manage settings via the UI.
### Alerting
[Section titled “Alerting”](#alerting)
Configure real-time log monitoring with email and webhook notifications through the Admin Settings UI. Per-alert recipients and webhook URLs are managed in the alert form.
**Settings available:**
* **Enabled**: Enable/disable alert evaluation and delivery
* **SMTP Host**: Email server hostname
* **SMTP Port**: Email server port
* **SMTP Username**: SMTP auth username (optional)
* **SMTP Password**: SMTP auth password (optional)
* **SMTP From**: From address for alert emails
* **SMTP Reply-To**: Reply-To address (optional)
* **SMTP Security**: `none`, `starttls`, or `tls`
* **Evaluation Interval**: How often to check all active alerts (e.g., “1m”)
* **Default Lookback**: Default time range for alert queries (e.g., “5m”)
* **History Limit**: Number of historical events to keep per alert (default: 50)
* **External URL**: Backend URL for API access
* **Frontend URL**: Frontend URL for web UI links in notifications
* **Request Timeout**: Alert notification request timeout (default: “5s”)
* **TLS Insecure Skip Verify**: Skip TLS cert verification (dev only)
**Optional `config.toml` seeding (first boot only):**
```toml
[alerts]
enabled = false
evaluation_interval = "1m"
default_lookback = "5m"
history_limit = 50
smtp_host = ""
smtp_port = 587
smtp_username = ""
smtp_password = ""
smtp_from = "alerts@example.com"
smtp_reply_to = ""
smtp_security = "starttls"
external_url = ""
frontend_url = ""
request_timeout = "5s"
tls_insecure_skip_verify = false
```
**Note:** After first boot, manage all alert settings via **Administration → System Settings → Alerts**.
For alert configuration examples, notification setup, and best practices, see the [alerting feature guide](/features/alerting).
## Environment Variables
[Section titled “Environment Variables”](#environment-variables)
All configuration options set in the TOML file can be overridden or supplied via environment variables. This is particularly useful for sensitive information like API keys or for containerized deployments.
Environment variables are prefixed with `LOGCHEF_`. For nested keys in the TOML structure, use a double underscore `__` to represent the nesting.
**Format:** `LOGCHEF_SECTION__KEY=value`
**Examples:**
* Set server port:
```bash
export LOGCHEF_SERVER__PORT=8125
```
* Set OIDC provider URL:
```bash
export LOGCHEF_OIDC__PROVIDER_URL="http://dex.example.com/dex"
```
* Set admin emails (comma-separated for arrays):
```bash
export LOGCHEF_AUTH__ADMIN_EMAILS="admin@example.com,ops@example.com"
```
* Set AI API Key:
```bash
export LOGCHEF_AI__API_KEY="sk-your_actual_api_key_here"
```
* Enable AI features and set the model:
```bash
export LOGCHEF_AI__ENABLED=true
export LOGCHEF_AI__MODEL="gpt-4o"
```
* Configure alerting:
```bash
export LOGCHEF_ALERTS__ENABLED=true
export LOGCHEF_ALERTS__SMTP_HOST="smtp.example.com"
export LOGCHEF_ALERTS__SMTP_PORT=587
export LOGCHEF_ALERTS__SMTP_FROM="alerts@example.com"
export LOGCHEF_ALERTS__FRONTEND_URL="https://logchef.example.com"
```
Environment variables take precedence over values defined in the TOML configuration file.
## Production Configuration
[Section titled “Production Configuration”](#production-configuration)
For production deployments, ensure you:
1. Set appropriate `host` and `port` values
2. Configure a secure `client_secret` for OIDC
3. Set the correct `redirect_url` matching your domain
4. Configure admin emails for initial access
5. Adjust session duration based on your security requirements
6. Set logging level to “info” or “warn”
7. If using AI features, ensure `LOGCHEF_AI__API_KEY` is set securely
8. If using alerting, configure SMTP settings and set `frontend_url` for correct generator links
9. Use `smtp_security` set to `tls` or `starttls` in production
## Minimal Production Configuration
[Section titled “Minimal Production Configuration”](#minimal-production-configuration)
This example shows the **essential configuration** required to run Logchef. All other settings (AI, alerting, sessions) are managed via the Admin Settings UI.
```toml
[server]
port = 8125
host = "0.0.0.0"
http_server_timeout = "30s"
[sqlite]
path = "/data/logchef.db"
[oidc]
provider_url = "https://dex.example.com"
auth_url = "https://dex.example.com/auth"
token_url = "https://dex.example.com/token"
client_id = "logchef"
client_secret = "your-secure-secret"
redirect_url = "https://logchef.example.com/api/v1/auth/callback"
scopes = ["openid", "email", "profile"]
[auth]
admin_emails = ["admin@example.com"]
api_token_secret = "your-secret-key-minimum-32-characters-long"
```
**After deployment:**
1. Login as admin user
2. Navigate to **Administration → System Settings**
3. Configure:
* **AI** tab: Enable AI features and add API key
* **Alerts** tab: Configure SMTP and notification settings
* **Authentication** tab: Set session duration and limits
* **Server** tab: Set frontend URL if needed
If your frontend is served from a different origin before first login, set `LOGCHEF_SERVER__FRONTEND_URL` in the environment to ensure auth redirects return to the UI.
See [`config.toml`](https://github.com/mr-karan/logchef/blob/main/config.toml) for a fully commented configuration example.
# Declarative Provisioning
> Manage Logchef teams, ClickHouse and VictoriaLogs sources, and access control via version-controlled config files for GitOps workflows.
Logchef supports declarative provisioning: define your teams, data sources, and access control in a TOML config file instead of (or alongside) the web UI. This enables GitOps workflows where infrastructure config is version-controlled and deployed automatically.
## How It Works
[Section titled “How It Works”](#how-it-works)
Provisioning uses a **managed vs unmanaged** strategy:
* **Managed resources**: Declared in your provisioning config. Logchef creates, updates, and optionally deletes them on startup. The API rejects manual edits to managed resources.
* **Unmanaged resources**: Created via the UI. Provisioning ignores them entirely.
This means you can gradually adopt provisioning: start by declaring a few sources, and leave everything else UI-managed.
## Quick Start
[Section titled “Quick Start”](#quick-start)
### 1. Create `provisioning.toml`
[Section titled “1. Create provisioning.toml”](#1-create-provisioningtoml)
```toml
manage_sources = true
manage_teams = true
prune = false
dry_run = true # Start with dry-run to verify
[[sources]]
name = "Production Logs"
source_type = "clickhouse"
meta_ts_field = "timestamp"
description = "Production application logs"
ttl_days = 30
[sources.connection]
host = "clickhouse.internal:9000"
username = "logchef"
password = "secret"
database = "logs"
table_name = "otel_logs"
[[teams]]
name = "Platform"
description = "Platform engineering"
sources = ["Production Logs"]
members = [
{ email = "alice@example.com", role = "admin" },
{ email = "bob@example.com", role = "editor" },
{ email = "carol@example.com", role = "member" },
]
```
Upgrading from a version before 2.0
The source format changed in 2.0: each `[[sources]]` now needs a `source_type` and a nested `[sources.connection]` block. If your `provisioning.toml` still puts `host` / `database` / `table_name` at the top level of a `[[sources]]` entry, the server refuses to start until you move those fields under `[sources.connection]` and add `source_type = "clickhouse"` (as shown above). Teams, members, and the non-connection fields (`description`, `ttl_days`, `meta_ts_field`) are unchanged.
### 2. Point config.toml to it
[Section titled “2. Point config.toml to it”](#2-point-configtoml-to-it)
```toml
[provisioning]
file = "provisioning.toml"
```
### 3. Start Logchef
[Section titled “3. Start Logchef”](#3-start-logchef)
On startup, Logchef reconciles the declared state with the database. With `dry_run = true`, it logs what it *would* do without making changes:
```plaintext
INFO provisioning dry-run complete, rolling back transaction
```
### 4. Apply for real
[Section titled “4. Apply for real”](#4-apply-for-real)
Once satisfied with the dry-run output, set `dry_run = false` and restart.
## Configuration Reference
[Section titled “Configuration Reference”](#configuration-reference)
### Top-Level Settings
[Section titled “Top-Level Settings”](#top-level-settings)
| Field | Type | Default | Description |
| ---------------- | ---- | ------- | -------------------------------------------- |
| `manage_sources` | bool | `false` | Enable declarative source management |
| `manage_teams` | bool | `false` | Enable declarative team management |
| `prune` | bool | `false` | Delete managed resources removed from config |
| `dry_run` | bool | `false` | Log changes without applying them |
### Source Fields
[Section titled “Source Fields”](#source-fields)
| Field | Required | Default | Description |
| --------------------- | ------------------- | ---------------------------------------------------- | -------------------------------------------------- |
| `name` | Yes | — | Unique display name (used as identity key) |
| `source_type` | No | `clickhouse` | Datasource backend: `clickhouse` or `victorialogs` |
| `connection` | Yes for new configs | — | Provider-specific connection block |
| `secret_ref` | No | — | Environment variable name for the provider secret |
| `meta_ts_field` | No | `timestamp` for ClickHouse, `_time` for VictoriaLogs | Timestamp field name |
| `meta_severity_field` | No | — | Severity/level column name |
| `description` | No | — | Human-readable description |
| `ttl_days` | No | `0` | Data retention in days |
For **ClickHouse**, the connection block looks like:
```toml
[[sources]]
name = "Production Logs"
source_type = "clickhouse"
meta_ts_field = "timestamp"
secret_ref = "LOGCHEF_CH_PROD_PASSWORD"
[sources.connection]
host = "clickhouse.internal:9000"
username = "logchef"
database = "logs"
table_name = "otel_logs"
```
For **VictoriaLogs**, use the native API connection shape:
```toml
[[sources]]
name = "Payments Logs"
source_type = "victorialogs"
meta_ts_field = "_time"
meta_severity_field = "level"
secret_ref = "LOGCHEF_VL_PROD_TOKEN"
[sources.connection]
base_url = "https://logs.example.com"
[sources.connection.auth]
mode = "bearer"
[sources.connection.tenant]
account_id = "12"
project_id = "34"
[sources.connection.scope]
query = "{app=\"payments\"} kubernetes.namespace:=prod"
```
The provisioning format is now nested and datasource-native. ClickHouse sources must use `source_type` plus the nested `connection` block rather than top-level `host` / `database` / `table_name` fields.
### Team Fields
[Section titled “Team Fields”](#team-fields)
| Field | Required | Description |
| ------------- | -------- | ------------------------------------------ |
| `name` | Yes | Unique display name (used as identity key) |
| `description` | No | Human-readable description |
| `sources` | No | List of source names this team can access |
| `members` | No | List of team members |
### Member Fields
[Section titled “Member Fields”](#member-fields)
| Field | Required | Default | Description |
| ------- | -------- | -------- | ----------------------------------------- |
| `email` | Yes | — | User’s email (must match OIDC identity) |
| `role` | No | `member` | Team role: `admin`, `editor`, or `member` |
## Secret Management
[Section titled “Secret Management”](#secret-management)
Never commit passwords to version control. Use `secret_ref` to reference environment variables:
```toml
[[sources]]
name = "Production Logs"
source_type = "clickhouse"
secret_ref = "LOGCHEF_CH_PROD_PASSWORD"
[sources.connection]
host = "clickhouse:9000"
username = "logchef"
database = "logs"
table_name = "otel_logs"
```
Set the environment variable before starting Logchef:
```bash
export LOGCHEF_CH_PROD_PASSWORD="actual-password"
```
For VictoriaLogs bearer auth, `secret_ref` fills `connection.auth.token`. For VictoriaLogs basic auth, it fills `connection.auth.password`.
For **Nomad** deployments, use Nomad variables with template blocks:
```toml
password = "{{ "{{.ch_prod_password}}" }}"
```
## Adopt Existing Resources
[Section titled “Adopt Existing Resources”](#adopt-existing-resources)
When you first enable provisioning on an existing Logchef instance, resources declared in config are matched against existing database records **by name**:
* A source named “Production Logs” in config matches an existing source named “Production Logs” in the DB
* Matched resources are adopted (marked as managed) and updated to match config
* Unmatched config entries create new resources
No special migration flag is needed. Adoption happens automatically on name match.
## Pruning
[Section titled “Pruning”](#pruning)
With `prune = false` (default), managed resources removed from config are **kept** but logged as warnings:
```plaintext
WARN managed source not in config (prune=false, keeping) name="Old Source"
```
With `prune = true`, they are **deleted**. Be careful:
Caution
Deleting a managed team cascades to its saved queries and alerts via database foreign key constraints. Always run with `dry_run = true` first when enabling pruning.
## API Protection
[Section titled “API Protection”](#api-protection)
Managed resources cannot be modified via the API or UI. Attempting to edit or delete a managed team/source/user returns:
```json
{
"status": "error",
"message": "This source is managed by provisioning config and cannot be modified via API",
"error_type": "ManagedResourceError"
}
```
## Export Current State
[Section titled “Export Current State”](#export-current-state)
Admins can export the current database state as a provisioning config via the API:
```bash
curl -s https://logchef.example.com/api/v1/admin/provisioning/export \
-H "Authorization: Bearer " | jq .
```
This returns a JSON representation of all sources, teams, and memberships, useful as a starting point for writing your `provisioning.toml`.
## Inline vs Separate File
[Section titled “Inline vs Separate File”](#inline-vs-separate-file)
You can define provisioning inline in `config.toml` or as a separate file:
**Separate file (recommended):**
config.toml
```toml
[provisioning]
file = "provisioning.toml"
```
**Inline:**
config.toml
```toml
[provisioning]
manage_sources = true
manage_teams = true
[[provisioning.sources]]
name = "My Logs"
source_type = "clickhouse"
[provisioning.sources.connection]
# ...
```
The separate file approach keeps secrets isolated and makes the provisioning config independently deployable.
# Quick Start
> Install Logchef, connect a ClickHouse or VictoriaLogs source, and run your first log query in minutes.
This guide will help you get Logchef up and running quickly. We’ll cover installation, basic setup, and how to make your first log query.
## Prerequisites
[Section titled “Prerequisites”](#prerequisites)
* Docker (for the recommended setup) or a Linux/macOS system for binary installation
* A ClickHouse or VictoriaLogs instance (ClickHouse is included in the Docker setup)
* SSO Provider (Dex is included in the Docker setup)
## Installation Options
[Section titled “Installation Options”](#installation-options)
### Using Docker (Recommended)
[Section titled “Using Docker (Recommended)”](#using-docker-recommended)
The Docker setup is the easiest way to get started with Logchef, as it includes everything you need: Logchef, ClickHouse, Dex SSO, and Vector for demo data.
```bash
# Download the compose file
curl -LO https://raw.githubusercontent.com/mr-karan/logchef/refs/heads/main/deployment/docker/docker-compose.yml
# Start the services
docker compose up -d
```
This will start:
* Logchef UI and API on port 8125 (accessible at )
* ClickHouse for log storage (ports 8123 and 9000)
* Dex SSO provider on port 5556
* Vector for generating demo logs
After starting, you can access the Logchef UI at `http://localhost:8125`.
The compose file demonstrates the ClickHouse path. The [VictoriaLogs tutorial](/tutorials/victorialogs) includes a one-command local VictoriaLogs server and a JSON-line ingestion example if you want to try the new datasource alongside it.
### Using Pre-built Binaries
[Section titled “Using Pre-built Binaries”](#using-pre-built-binaries)
For production deployments or running without Docker, you can download pre-built binaries:
```bash
# Grab the latest version tag from https://github.com/mr-karan/logchef/releases/latest (e.g. 2.0.0), set it once, then download:
VERSION="2.0.0"
# Download the release for your platform (example for Linux amd64)
curl -L -O https://github.com/mr-karan/logchef/releases/download/v${VERSION}/logchef_${VERSION}_linux_amd64.tar.gz
# Extract the archive
tar xzf logchef_${VERSION}_linux_amd64.tar.gz
# Make the binary executable
chmod +x logchef
# Create a basic configuration file
curl -L -O https://github.com/mr-karan/logchef/raw/main/config.toml
# Edit the config file to match your environment. The quickest path is
# built-in email + password login: enable [auth.local] and set a bootstrap
# admin. No external identity provider needed. OIDC/SSO is optional.
#
# [auth.local]
# enabled = true
# admin_email = "admin@example.com"
# # supply the password via env instead of the file:
# # export LOGCHEF_AUTH__LOCAL__ADMIN_PASSWORD="a-strong-password"
# Run Logchef with your config
./logchef -config config.toml
```
### Building from Source
[Section titled “Building from Source”](#building-from-source)
If you prefer to build from source:
```bash
# Clone the repository
git clone https://github.com/mr-karan/logchef.git
cd logchef
# Build the frontend and backend
just build
# Run with the default config
just run
```
## First Login
[Section titled “First Login”](#first-login)
1. After starting Logchef, visit `http://localhost:8125` in your browser
2. Sign in with email and password (local auth), or use the SSO button if you configured OIDC
3. For the Docker setup, use the default credentials:
* Email: `admin@logchef.internal`
* Password: `password`
## Initial Setup
[Section titled “Initial Setup”](#initial-setup)
Before you can start querying logs, you need to set up a team, create a data source, and assign the source to your team.
### 1. Create a Team
[Section titled “1. Create a Team”](#1-create-a-team)
1. Navigate to Access > Teams
2. Click “Add Team”
3. Enter a team name (e.g., “Engineering”)
4. Save the team
### 2. Add Yourself to the Team
[Section titled “2. Add Yourself to the Team”](#2-add-yourself-to-the-team)
1. From the Teams page, select your newly created team
2. Under Team Members, click “Add User”
3. Add your email address and select appropriate permissions
4. Save changes
### 3. Configure a Data Source
[Section titled “3. Configure a Data Source”](#3-configure-a-data-source)
Choose either backend. Logchef does not copy data between them; a source points at logs that already exist in ClickHouse or VictoriaLogs.
#### ClickHouse from the Docker setup
[Section titled “ClickHouse from the Docker setup”](#clickhouse-from-the-docker-setup)
1. Navigate to Sources > Manage Sources
2. Click “Add Source”
3. Enter your ClickHouse connection details:
```plaintext
Name: Demo Logs
Host: clickhouse:9000 (Docker) or localhost:9000 (host process)
Database: default
Table: logs
Timestamp Field: timestamp
Severity Field: severity_text
```
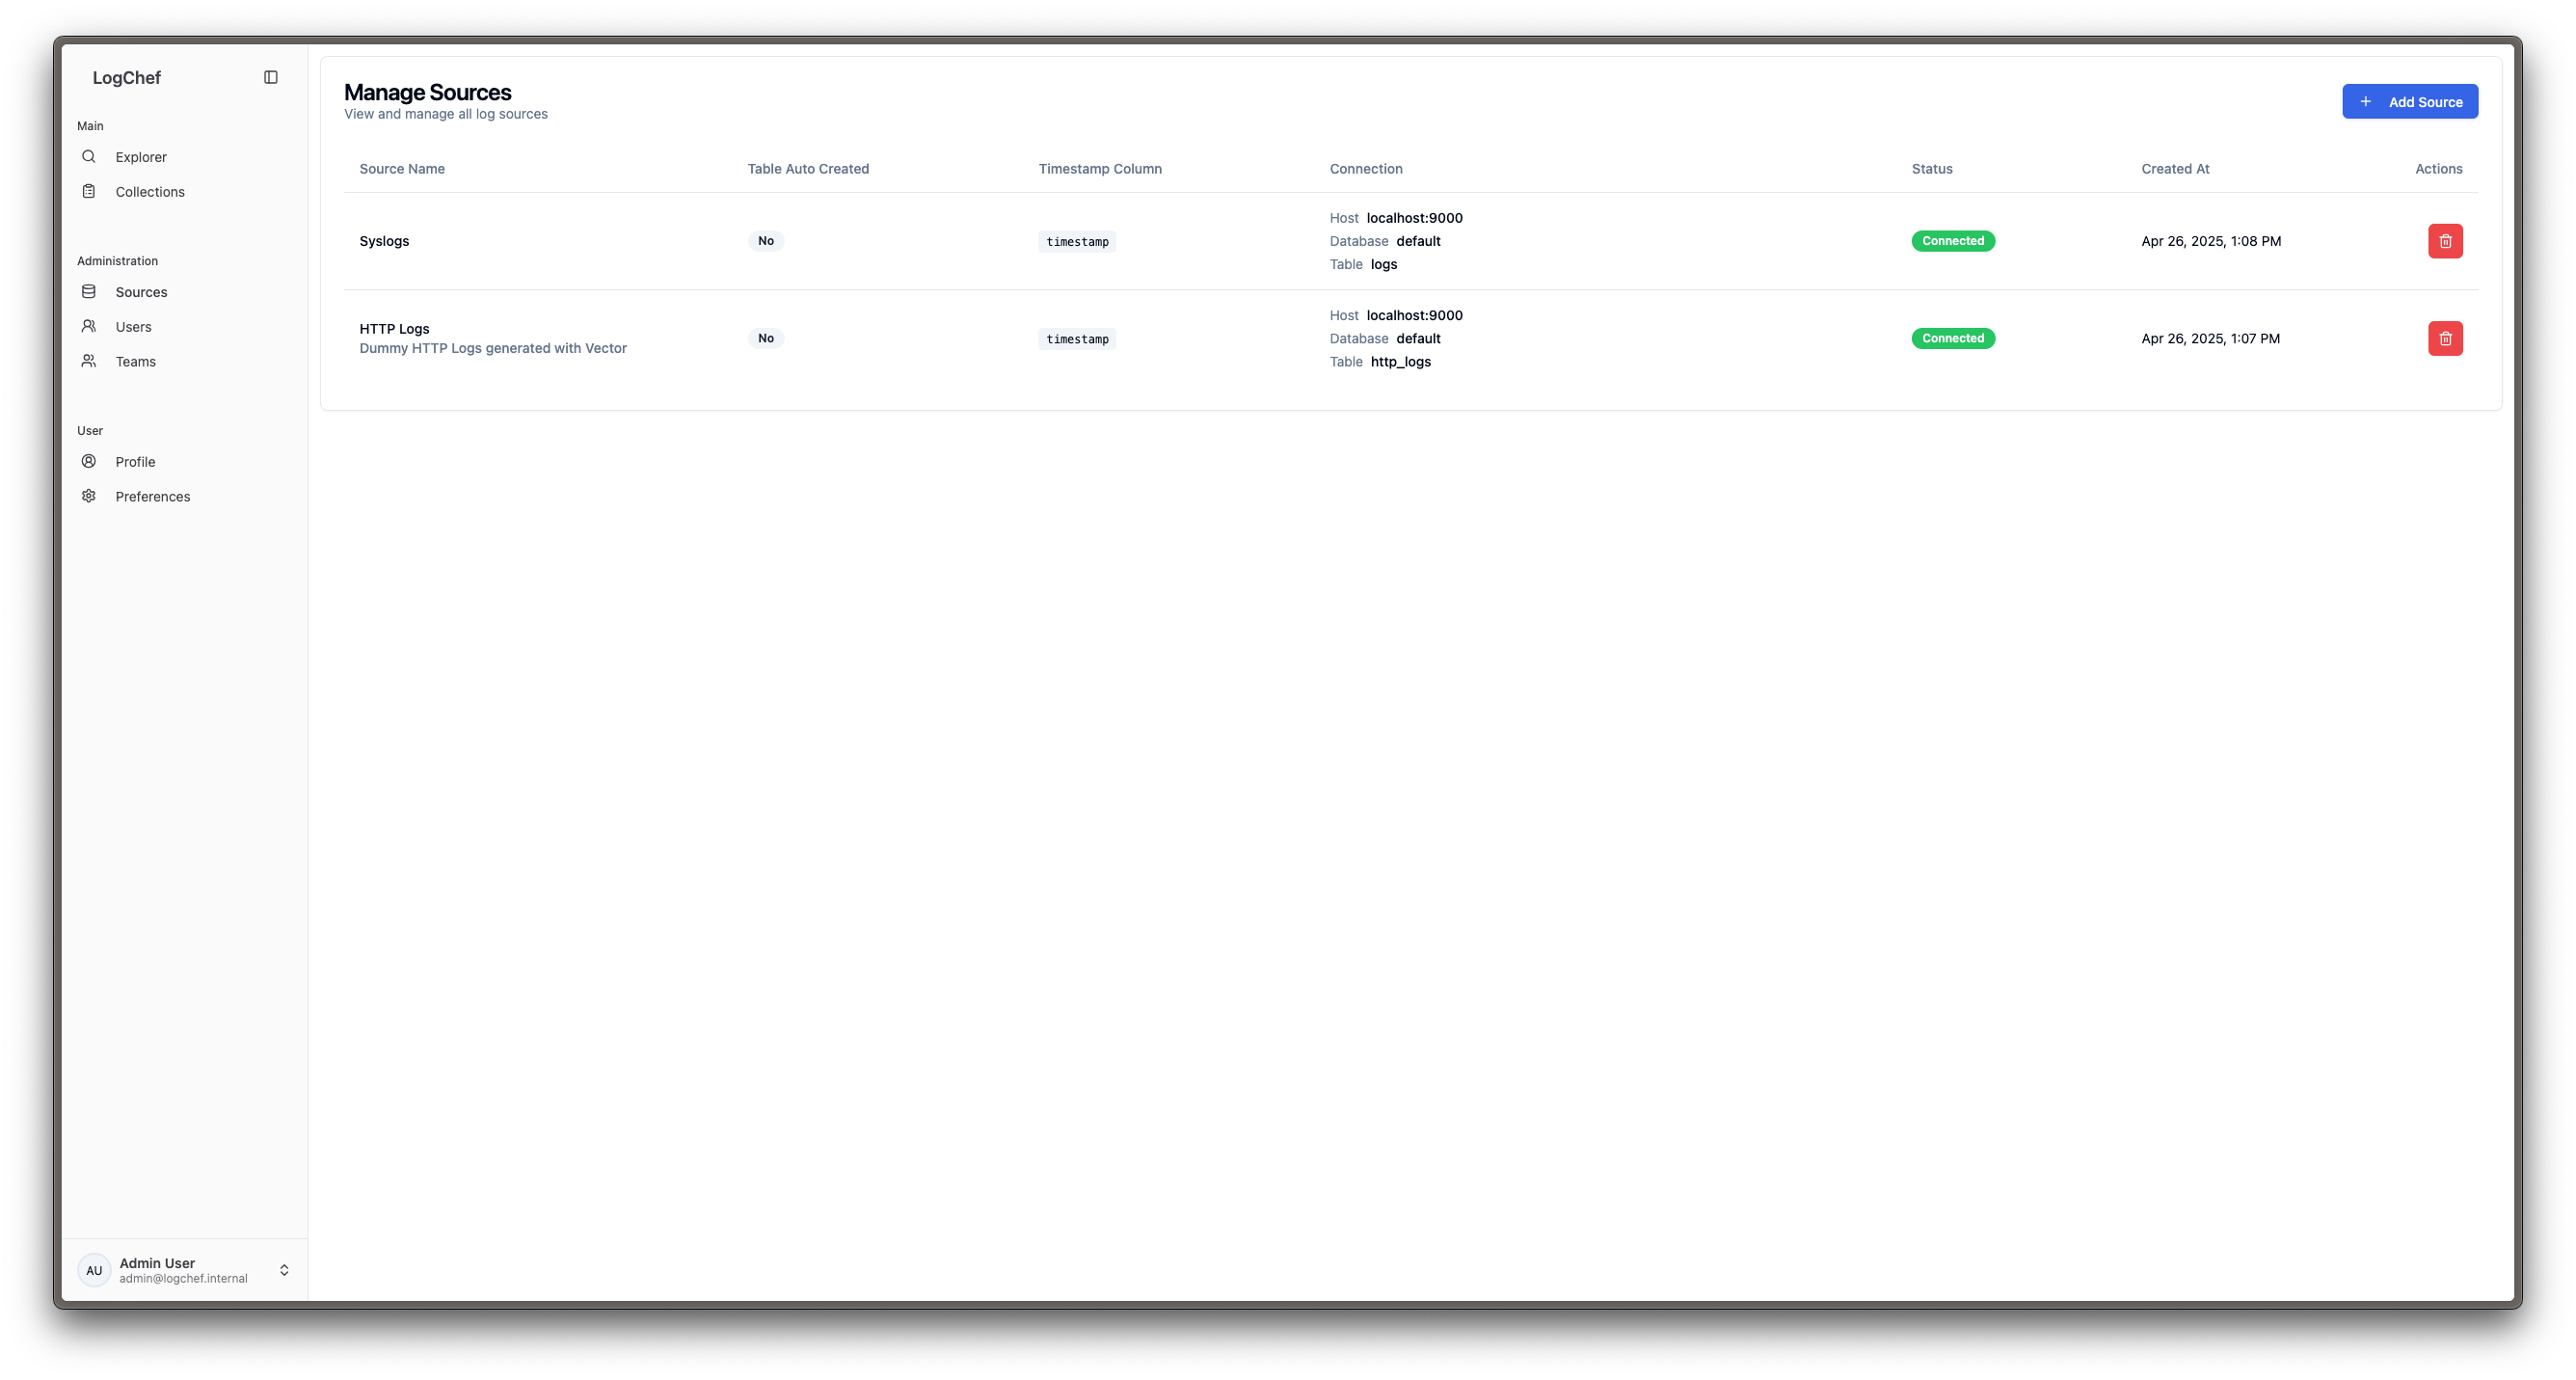
4. Test the connection and save
#### VictoriaLogs
[Section titled “VictoriaLogs”](#victorialogs)
For a local VictoriaLogs instance, first ingest the sample from the [end-to-end VictoriaLogs example](/tutorials/victorialogs#end-to-end-local-example). Then choose **VictoriaLogs** in the Add Source form and use:
```text
Name: VictoriaLogs Demo
Base URL: http://victorialogs:9428
Authentication: No Auth
Timestamp Field: _time
Severity Field: level
```
If Logchef runs in Docker and VictoriaLogs is another container, both containers must share a network and the base URL must use the VictoriaLogs service or container name, for example `http://victorialogs:9428`. From inside a container, `localhost` refers to that same container.
Choose **Validate Connection**, then save the source. Validation checks health, field discovery, and real query access.
### 4. Assign the Source to Your Team
[Section titled “4. Assign the Source to Your Team”](#4-assign-the-source-to-your-team)
1. Navigate to Access > Teams
2. Select your team
3. Under Data Sources, click “Add Source”
4. Select the source you created and save
## Writing Your First Query
[Section titled “Writing Your First Query”](#writing-your-first-query)
Now you’re ready to explore your logs:
1. Go to the Explore page
2. Select your team and data source
3. Try some example queries:
Basic search:
```plaintext
namespace="syslog"
```
Search for specific text in the log body with `~`, the case-insensitive substring operator:
```text
namespace="syslog" and body~"error"
```
For the VictoriaLogs sample, the same LogchefQL workflow looks like:
```text
env="demo" and level="error"
```
Switch the editor to **LogsQL** when you need the native language:
```text
env:="demo" AND level:="error" | fields _time, service, level, _msg
```
## Build Your First Dashboard
[Section titled “Build Your First Dashboard”](#build-your-first-dashboard)
1. Open **Dashboards** and choose **New dashboard**
2. Open the dashboard, choose **Edit**, then **Add panel**
3. Pick a team and source, enter a LogchefQL filter, and choose a time series, stat, breakdown, or table panel
4. Use **group by** on a time series or breakdown to split counts by a field such as service or severity
5. Add panels from either ClickHouse or VictoriaLogs, arrange the grid, and save
Every panel follows one dashboard time range and refresh interval. See [Dashboards](/features/dashboards) for a VictoriaLogs example, native LogsQL behavior, permissions, and result caching.
## Next Steps
[Section titled “Next Steps”](#next-steps)
* Learn more about the [search syntax](/guide/search-syntax)
* Explore [advanced querying examples](/guide/examples)
* Set up [Vector integration](/integration/vector) for your own logs
* Connect [VictoriaLogs end to end](/tutorials/victorialogs)
* Build a mixed-source [dashboard](/features/dashboards)
* Learn about [user management](/core/user-management)
# Query Examples
> Practical LogchefQL query examples for common log analytics scenarios, from basic filters to more advanced field searches.
This guide provides practical examples for common log analytics scenarios using Logchef. Each example includes both the LogchefQL syntax and the equivalent SQL query.
## Error Analysis
[Section titled “Error Analysis”](#error-analysis)
### Finding All Errors
[Section titled “Finding All Errors”](#finding-all-errors)
Find all errors across all services to get an overview of system health.
```plaintext
level="error"
```
SQL Equivalent
```sql
SELECT *
FROM logs.app
WHERE level = 'error'
ORDER BY timestamp DESC
LIMIT 100
```
### Service-specific Errors
[Section titled “Service-specific Errors”](#service-specific-errors)
Narrow down errors to a specific service when troubleshooting issues in that component.
```plaintext
level="error" and service="payment-api"
```
SQL Equivalent
```sql
SELECT *
FROM logs.app
WHERE level = 'error'
AND service = 'payment-api'
ORDER BY timestamp DESC
LIMIT 100
```
### Errors Excluding Debug Noise
[Section titled “Errors Excluding Debug Noise”](#errors-excluding-debug-noise)
Find errors while excluding specific patterns that aren’t relevant.
```plaintext
level="error" and message!~"health check"
```
SQL Equivalent
```sql
SELECT *
FROM logs.app
WHERE level = 'error'
AND positionCaseInsensitive(message, 'health check') = 0
ORDER BY timestamp DESC
LIMIT 100
```
### Critical vs Warning Analysis
[Section titled “Critical vs Warning Analysis”](#critical-vs-warning-analysis)
Compare different severity levels.
```plaintext
severity_number>=4 or level="critical"
```
SQL Equivalent
```sql
SELECT *
FROM logs.app
WHERE severity_number >= 4
OR level = 'critical'
ORDER BY timestamp DESC
LIMIT 100
```
## HTTP Logs Analysis
[Section titled “HTTP Logs Analysis”](#http-logs-analysis)
### Server Errors (5xx Status Codes)
[Section titled “Server Errors (5xx Status Codes)”](#server-errors-5xx-status-codes)
Identify all server-side errors to find potential backend issues.
```plaintext
status>=500
```
SQL Equivalent
```sql
SELECT *
FROM logs.app
WHERE status >= 500
ORDER BY timestamp DESC
LIMIT 100
```
### Slow API Requests
[Section titled “Slow API Requests”](#slow-api-requests)
Find API requests that took longer than 1 second to complete, which may indicate performance bottlenecks.
```plaintext
request_path~"/api/" and response_time>1000
```
SQL Equivalent
```sql
SELECT *
FROM logs.app
WHERE positionCaseInsensitive(request_path, '/api/') > 0
AND response_time > 1000
ORDER BY timestamp DESC
LIMIT 100
```
### Client Errors for a Specific Endpoint
[Section titled “Client Errors for a Specific Endpoint”](#client-errors-for-a-specific-endpoint)
Find client errors (4xx) for a specific API endpoint to identify potential client integration issues.
```plaintext
status>=400 and status<500 and request_path~"/api/payments"
```
SQL Equivalent
```sql
SELECT *
FROM logs.app
WHERE status >= 400
AND status < 500
AND positionCaseInsensitive(request_path, '/api/payments') > 0
ORDER BY timestamp DESC
LIMIT 100
```
### Request Latency Analysis
[Section titled “Request Latency Analysis”](#request-latency-analysis)
Find requests within specific latency ranges.
```plaintext
# Very slow requests (over 5 seconds)
response_time>5000
# Fast requests (under 100ms)
response_time<100
# Requests in a specific range
response_time>=100 and response_time<=500
```
## Nested Field Queries
[Section titled “Nested Field Queries”](#nested-field-queries)
LogchefQL supports querying nested fields in Map and JSON columns using dot notation.
### Map Column Access
[Section titled “Map Column Access”](#map-column-access)
Query logs by attributes stored in Map columns (common in OpenTelemetry logs).
```plaintext
# Filter by user ID in attributes
log_attributes.user_id="user-12345"
```
SQL Equivalent
```sql
SELECT *
FROM logs.app
WHERE log_attributes['user_id'] = 'user-12345'
ORDER BY timestamp DESC
LIMIT 100
```
### Multi-level Nesting
[Section titled “Multi-level Nesting”](#multi-level-nesting)
Access deeply nested fields.
```plaintext
# Query nested request attributes
log_attributes.http.request.method="POST"
# Query nested error details
log_attributes.error.code="CONNECTION_REFUSED"
```
SQL Equivalent
```sql
SELECT *
FROM logs.app
WHERE log_attributes['http.request.method'] = 'POST'
ORDER BY timestamp DESC
LIMIT 100
```
### Pattern Matching in Nested Fields
[Section titled “Pattern Matching in Nested Fields”](#pattern-matching-in-nested-fields)
Use contains operator on nested values.
```plaintext
log_attributes.request.url~"/api/v2/"
```
SQL Equivalent
```sql
SELECT *
FROM logs.app
WHERE positionCaseInsensitive(log_attributes['request.url'], '/api/v2/') > 0
ORDER BY timestamp DESC
LIMIT 100
```
### JSON Column Extraction
[Section titled “JSON Column Extraction”](#json-column-extraction)
For JSON or String columns containing JSON, LogchefQL uses `JSONExtractString`.
```plaintext
body.request.user_agent~"Mozilla"
```
SQL Equivalent
```sql
SELECT *
FROM logs.app
WHERE positionCaseInsensitive(JSONExtractString(body, 'request', 'user_agent'), 'Mozilla') > 0
ORDER BY timestamp DESC
LIMIT 100
```
### Quoted Field Names
[Section titled “Quoted Field Names”](#quoted-field-names)
For field names containing dots or special characters.
```plaintext
# Field name literally contains a dot
log_attributes."service.name"="payment-api"
# Mixed quoted and unquoted
log_attributes."nested.key".subfield="value"
```
## Using the Pipe Operator
[Section titled “Using the Pipe Operator”](#using-the-pipe-operator)
The pipe operator (`|`) lets you select specific columns instead of `SELECT *`.
### Basic Column Selection
[Section titled “Basic Column Selection”](#basic-column-selection)
Select only the fields you need.
```plaintext
level="error" | timestamp service level message
```
SQL Equivalent
```sql
SELECT timestamp, service, level, message
FROM logs.app
WHERE level = 'error'
ORDER BY timestamp DESC
LIMIT 100
```
### Extracting Nested Values
[Section titled “Extracting Nested Values”](#extracting-nested-values)
Pull specific values from nested structures.
```plaintext
namespace="prod" | timestamp log_attributes.user_id log_attributes.request_id body
```
SQL Equivalent
```sql
SELECT
timestamp,
log_attributes['user_id'] AS log_attributes_user_id,
log_attributes['request_id'] AS log_attributes_request_id,
body
FROM logs.app
WHERE namespace = 'prod'
ORDER BY timestamp DESC
LIMIT 100
```
### Minimal Output for Scanning
[Section titled “Minimal Output for Scanning”](#minimal-output-for-scanning)
When you just need to scan for specific patterns.
```plaintext
message~"error" | timestamp message
```
### Service Overview
[Section titled “Service Overview”](#service-overview)
Get a quick view of service activity.
```plaintext
namespace="production" | timestamp service_name level
```
## Security Analysis
[Section titled “Security Analysis”](#security-analysis)
### Failed Authentication Attempts
[Section titled “Failed Authentication Attempts”](#failed-authentication-attempts)
Identify potential brute force attacks by finding multiple failed login attempts.
```plaintext
event="login_failed" and ip_address~"192.168."
```
SQL Equivalent
```sql
SELECT *
FROM logs.app
WHERE event = 'login_failed'
AND positionCaseInsensitive(ip_address, '192.168.') > 0
ORDER BY timestamp DESC
LIMIT 100
```
### Suspicious Activity Detection
[Section titled “Suspicious Activity Detection”](#suspicious-activity-detection)
Find logs that might indicate suspicious activities based on warning messages.
```plaintext
level="warn" and (message~"suspicious" or message~"unauthorized")
```
SQL Equivalent
```sql
SELECT *
FROM logs.app
WHERE level = 'warn'
AND (
positionCaseInsensitive(message, 'suspicious') > 0
OR positionCaseInsensitive(message, 'unauthorized') > 0
)
ORDER BY timestamp DESC
LIMIT 100
```
### Access Pattern Analysis
[Section titled “Access Pattern Analysis”](#access-pattern-analysis)
Track access to sensitive endpoints.
```plaintext
request_path~"/admin" or request_path~"/api/internal"
```
## System Monitoring
[Section titled “System Monitoring”](#system-monitoring)
### High Resource Usage
[Section titled “High Resource Usage”](#high-resource-usage)
Detect potential resource bottlenecks by finding instances of high CPU or memory usage.
```plaintext
type="system_metrics" and (cpu_usage>90 or memory_usage>85)
```
SQL Equivalent
```sql
SELECT *
FROM logs.app
WHERE type = 'system_metrics'
AND (cpu_usage > 90 OR memory_usage > 85)
ORDER BY timestamp DESC
LIMIT 100
```
### Failed Service Health Checks
[Section titled “Failed Service Health Checks”](#failed-service-health-checks)
Monitor service health by finding instances where health checks have failed.
```plaintext
event="health_check" and status!="ok"
```
SQL Equivalent
```sql
SELECT *
FROM logs.app
WHERE event = 'health_check'
AND status != 'ok'
ORDER BY timestamp DESC
LIMIT 100
```
### Disk Space Warnings
[Section titled “Disk Space Warnings”](#disk-space-warnings)
Identify servers that are running low on disk space and might need attention.
```plaintext
type="system_metrics" and disk_free_percent<15
```
SQL Equivalent
```sql
SELECT *
FROM logs.app
WHERE type = 'system_metrics'
AND disk_free_percent < 15
ORDER BY timestamp DESC
LIMIT 100
```
## Distributed Tracing
[Section titled “Distributed Tracing”](#distributed-tracing)
### Complete Request Trace
[Section titled “Complete Request Trace”](#complete-request-trace)
Trace a complete request flow across multiple services using a trace ID.
```plaintext
trace_id="abc123def456"
```
SQL Equivalent
```sql
SELECT *
FROM logs.app
WHERE trace_id = 'abc123def456'
ORDER BY timestamp ASC
LIMIT 1000
```
### Service Dependency Analysis
[Section titled “Service Dependency Analysis”](#service-dependency-analysis)
Find all the services involved in a specific transaction to understand service dependencies.
```plaintext
trace_id="abc123def456" and level="info" and event="service_call"
```
SQL Equivalent
```sql
SELECT service, remote_service, timestamp
FROM logs.app
WHERE trace_id = 'abc123def456'
AND level = 'info'
AND event = 'service_call'
ORDER BY timestamp ASC
LIMIT 100
```
### Trace with Specific Fields
[Section titled “Trace with Specific Fields”](#trace-with-specific-fields)
Get a focused view of a trace with only relevant fields.
```plaintext
trace_id="abc123def456" | timestamp service_name span_id body
```
## OpenTelemetry Log Queries
[Section titled “OpenTelemetry Log Queries”](#opentelemetry-log-queries)
LogchefQL works great with OpenTelemetry log data.
### Filter by Resource Attributes
[Section titled “Filter by Resource Attributes”](#filter-by-resource-attributes)
```plaintext
log_attributes.service.name="frontend" and severity_text="ERROR"
```
### Kubernetes Context
[Section titled “Kubernetes Context”](#kubernetes-context)
```plaintext
log_attributes.k8s.namespace.name="production" and log_attributes.k8s.pod.name~"api-"
```
### Span Correlation
[Section titled “Span Correlation”](#span-correlation)
```plaintext
trace_id!="" and span_id!="" and level="error"
```
## Effective Query Tips
[Section titled “Effective Query Tips”](#effective-query-tips)
1. **Start Specific, Then Broaden**
* Begin with specific conditions that target your issue
* Add or remove filters to adjust the result set size
2. **Use Comparison Operators for Metrics**
* `response_time>1000` is cleaner than text matching
* Works well with numeric fields like status codes, durations, counts
3. **Use Nested Field Access**
* Query Map and JSON columns directly: `log_attributes.user_id="123"`
* No need to flatten your log schema
4. **Use the Pipe Operator for Focus**
* `level="error" | timestamp service message` reduces noise
* Faster queries when you don’t need all columns
5. **Combine Multiple Conditions**
* Use `and` to narrow results
* Use `or` to broaden results
* Use parentheses for complex conditions: `(condition1 or condition2) and condition3`
6. **Filter by Context First**
* Start with service, component, or environment
* Then add conditions for errors, warnings, or specific events
* Finally, add free-text search terms with the `~` operator
7. **Switch to SQL Mode for Aggregations**
* LogchefQL is for filtering; use SQL mode for `COUNT`, `GROUP BY`, etc.
## Next steps
[Section titled “Next steps”](#next-steps)
* Read the full [Search Syntax](/guide/search-syntax) reference for every operator
* Save queries you use often to a [Collection](/features/collections) for your team
* See the [Query Interface](/user-guide/query-interface) guide for time controls and result views
# LogsQL Queries
> Use native LogsQL in Logchef against VictoriaLogs — common query patterns, how LogchefQL compiles to LogsQL, and tenancy/scope behavior.
VictoriaLogs sources in Logchef support two query languages: **LogchefQL** (Logchef’s shared quick-filter syntax, also used on ClickHouse sources) and native **LogsQL** (VictoriaLogs’ own query language). This page focuses on LogsQL: how native mode behaves in Logchef, useful query patterns, and exactly how LogchefQL is compiled down to LogsQL.
For the full LogchefQL syntax reference, see [Search Syntax](/guide/search-syntax). For a wider tour of what Logchef adds on top of VictoriaLogs, see [VictoriaLogs Explorer](/tutorials/victorialogs-explorer).
## Native LogsQL mode
[Section titled “Native LogsQL mode”](#native-logsql-mode)
For large sources, [windowed search](/guide/windowed-search) returns filter-only queries in pages, newest first. Queries with pipes keep the standard execution path.
Switch a VictoriaLogs source’s query editor to native mode to write LogsQL directly. A few things behave differently from LogchefQL mode:
* **Time range is applied separately.** The selected time range is sent as `start`/`end` parameters alongside your query text, not baked into the query string — so you don’t need (and shouldn’t add) your own `_time:` filter unless you want to override the picker.
* **Results are sorted newest-first automatically**, matching LogchefQL mode: Logchef appends `| sort by (_time desc)` to a query that has no pipes, or only `fields` pipes. A query using `stats`, its own `sort`, `limit`, or any other pipe stage is left untouched — at that point you’re in full control of ordering.
* **A row limit is always applied.** An unspecified limit defaults to the source’s configured default (1000, unless your admin changed it), and any limit you do set is capped at the source’s configured maximum. Logchef surfaces a warning banner when either happens.
```text
service:="api" level:="error"
```
runs as-is against `/select/logsql/query` with your picked time range, and comes back sorted by `_time` descending.
```text
service:="api" level:="error" | stats count() as errors
```
is left exactly as written (it has a `stats` pipe), and returns one row.
## Common LogsQL patterns
[Section titled “Common LogsQL patterns”](#common-logsql-patterns)
These are standard [LogsQL](https://docs.victoriametrics.com/victorialogs/logsql/) syntax, usable in Logchef’s native mode exactly as you’d use them against VictoriaLogs directly.
**Exact match and negation**
```text
level:="error"
NOT level:="error"
```
**Substring / regex match**
```text
_msg:~"(?i)timeout"
service:!~"^test-"
```
**Numeric comparisons**
```text
status_code:>=500
response_time_ms:>1000
```
**Combining filters**
```text
(service:="api" OR service:="gateway") AND level:="error"
```
**Field projection**
```text
service:="api" | fields _time, _msg, service, status_code
```
**Aggregation (for alert queries or dashboards)**
```text
service:="payments" level:="error" | stats count() as value
service:="api" | stats avg(response_time_ms) as value
```
**Unpacking a JSON field**
```text
service:="api" | unpack_json from extra_fields | fields _time, _msg, user_id
```
See the [official LogsQL examples](https://docs.victoriametrics.com/victorialogs/logsql-examples/) for more pipe types (`facets`, `top`, `uniq`, and others) — anything valid LogsQL runs unchanged through Logchef’s native mode.
## How LogchefQL compiles to LogsQL
[Section titled “How LogchefQL compiles to LogsQL”](#how-logchefql-compiles-to-logsql)
For a VictoriaLogs source, every LogchefQL query is translated into LogsQL before it’s sent to VictoriaLogs — the translated LogsQL is what actually executes. The mapping:
| LogchefQL | Generated LogsQL |
| -------------------------------------------------------- | ------------------------------------------------------------------------- |
| `level = "error"` | `level:="error"` |
| `level != "error"` | `NOT level:="error"` |
| `status_code >= 500` | `status_code:>=500` |
| `_msg ~ "timeout"` | `_msg:~"(?i)timeout"` |
| `path !~ "internal"` | `NOT path:~"(?i)internal"` |
| `service = "api" and env = "prod"` | `(service:="api") AND (env:="prod")` |
| `service = "api" and status_code >= 500 \| _msg service` | `(service:="api") AND (status_code:>=500) \| fields _time, _msg, service` |
A few details worth knowing:
* **`~` and `!~` are literal, case-insensitive substring matches, not arbitrary regex.** LogchefQL escapes any regex-special characters in your search text and wraps it in `(?i)`, so `body ~ "user[1]"` looks for the literal text `user[1]`, not a regex character class. If you need a real regex, write it directly in native LogsQL.
* **The pipe operator (`field1 field2 ...`) becomes a LogsQL `fields` pipe**, and the source’s configured timestamp field is always included first even if you didn’t ask for it, so timestamps never silently disappear from projected results.
* **`null` comparisons aren’t supported** for VictoriaLogs — LogchefQL’s translator rejects them rather than guessing at LogsQL’s handling of missing fields.
## Tenancy and scope behavior
[Section titled “Tenancy and scope behavior”](#tenancy-and-scope-behavior)
Every request Logchef makes to VictoriaLogs for a given source — explore queries, histograms, field-values lookups, facets, live tail, and alert evaluation — carries the same tenancy and scope configuration:
* **Tenant headers**: if a source has `AccountID` / `ProjectID` configured, both are sent as `AccountID` / `ProjectID` HTTP headers on every request.
* **Immutable scope filter**: if a source has a scope query configured, it’s added to every request as an additional filter — either as a stream filter (when the scope is written as `{...}`, e.g. `{app="payments"}`) or as a plain filter expression (e.g. `kubernetes.namespace:="prod"`) appended alongside your query.
This scope can’t be bypassed from the query editor — it’s applied server-side regardless of query language or mode, so a source pinned to one tenant or namespace stays pinned to it.
**Schema and field discovery ignore pipes.** Field-name discovery, field-values lookups, and facets requests run with `ignore_pipes` set, meaning only the filter portion of your query is used — any `stats`, `sort`, or `fields` pipe in the query text is ignored for those lookups. This keeps field discovery reflecting “what fields exist given these filters,” not “what the pipe output looks like.”
## Next steps
[Section titled “Next steps”](#next-steps)
* [VictoriaLogs Explorer](/tutorials/victorialogs-explorer) — what Logchef adds on top of VictoriaLogs’ vmui
* [Using VictoriaLogs with Logchef](/tutorials/victorialogs) — connect a source and configure ingestion
* [Search Syntax](/guide/search-syntax) — the full LogchefQL reference
* [Alerting](/features/alerting) — evaluate a LogsQL query on a schedule
# Search Syntax
> Learn LogchefQL, Logchef's search syntax for filtering and querying logs without writing SQL.
**LogchefQL** is Logchef’s search syntax. You use it to filter logs without writing SQL.
LogchefQL is the quick-filter language shared across supported datasources:
* **ClickHouse** sources compile LogchefQL to SQL
* **VictoriaLogs** sources compile LogchefQL to LogsQL
## Basic Syntax
[Section titled “Basic Syntax”](#basic-syntax)
The basic syntax follows a simple key-value pattern:
```plaintext
key="value"
```
For example:
```plaintext
level="error"
service="payment-api"
```
## Operators
[Section titled “Operators”](#operators)
LogchefQL supports these operators:
### Equality Operators
[Section titled “Equality Operators”](#equality-operators)
| Operator | Description | Example |
| -------- | ----------- | ---------------- |
| `=` | Equals | `status=200` |
| `!=` | Not equals | `level!="debug"` |
### Pattern Matching Operators
[Section titled “Pattern Matching Operators”](#pattern-matching-operators)
| Operator | Description | Example |
| -------- | --------------------------- | ------------------- |
| `~` | Contains (case-insensitive) | `message~"timeout"` |
| `!~` | Does not contain | `path!~"health"` |
### Comparison Operators
[Section titled “Comparison Operators”](#comparison-operators)
| Operator | Description | Example |
| -------- | ------------------------ | -------------------- |
| `>` | Greater than | `status>400` |
| `<` | Less than | `response_time<1000` |
| `>=` | Greater than or equal to | `severity_number>=3` |
| `<=` | Less than or equal to | `duration<=5000` |
## Combining Conditions
[Section titled “Combining Conditions”](#combining-conditions)
You can combine multiple conditions using `and` and `or` operators (case-insensitive):
```plaintext
# Find errors in payment service
level="error" and service="payment-api"
# Find successful or redirected responses
status=200 or status=301
# Complex combinations with parentheses
(service="auth" or service="users") and level="error"
# Find slow requests with errors
response_time>1000 and status>=500
```
## Nested Field Access
[Section titled “Nested Field Access”](#nested-field-access)
LogchefQL supports accessing nested fields using **dot notation**. This works with:
* **Map columns** (e.g., `Map(String, String)`)
* **JSON columns**
* **String columns containing JSON**
### Dot Notation
[Section titled “Dot Notation”](#dot-notation)
Access nested keys using dots:
```plaintext
# Access nested field in a Map column
log_attributes.user_id="12345"
# Multi-level nesting
log_attributes.request.method="POST"
# Pattern matching on nested fields
log_attributes.error.message~"connection refused"
```
### Quoted Field Names
[Section titled “Quoted Field Names”](#quoted-field-names)
For field names containing special characters (like dots), use quotes:
```plaintext
# Field name contains a literal dot
log_attributes."user.name"="alice"
# Mixed notation
log_attributes."nested.key".subfield="value"
```
## Pipe Operator (Custom SELECT)
[Section titled “Pipe Operator (Custom SELECT)”](#pipe-operator-custom-select)
The pipe operator (`|`) selects specific columns instead of the default `SELECT *`. Use it for:
* Reducing data transfer
* Focusing on relevant fields
* Extracting specific nested values
### Syntax
[Section titled “Syntax”](#syntax)
```plaintext
| ...
```
### Examples
[Section titled “Examples”](#examples)
```plaintext
# Select only service_name from syslog namespace
namespace="syslog" | service_name
# Select multiple fields
namespace="prod" | namespace service_name body
# Select nested fields
level="error" | timestamp log_attributes.request_id body
# Extract specific nested values
service="api" | timestamp log_attributes.user_id log_attributes.endpoint
```
The selected fields appear as columns in the result set, making it easy to focus on the data you need.
## Examples
[Section titled “Examples”](#examples-1)
### Finding Errors
[Section titled “Finding Errors”](#finding-errors)
```plaintext
level="error"
```
### HTTP Status Codes
[Section titled “HTTP Status Codes”](#http-status-codes)
```plaintext
# Server errors
status>=500
# Client errors
status>=400 and status<500
# Successful requests
status=200
```
### Service-specific Logs
[Section titled “Service-specific Logs”](#service-specific-logs)
```plaintext
service="payment-api" and level="error"
```
### Partial Text Search
[Section titled “Partial Text Search”](#partial-text-search)
```plaintext
# Find logs containing "timeout"
message~"timeout"
# Find paths not containing "internal"
path!~"internal"
```
### Performance Analysis
[Section titled “Performance Analysis”](#performance-analysis)
```plaintext
# Slow requests (over 1 second)
response_time>1000
# Very fast requests (under 10ms)
response_time<10
```
### Nested Field Queries
[Section titled “Nested Field Queries”](#nested-field-queries)
```plaintext
# Filter by nested attribute
log_attributes.user_id="user-123"
# Pattern match in nested JSON
body~"error" and log_attributes.request.method="POST"
```
## Under the Hood
[Section titled “Under the Hood”](#under-the-hood)
When you use LogchefQL, Logchef converts it to the selected datasource’s native query language before execution.
### ClickHouse
[Section titled “ClickHouse”](#clickhouse)
For ClickHouse sources, LogchefQL converts to optimized SQL queries:
* The `~` and `!~` operators use ClickHouse’s `positionCaseInsensitive` function for efficient partial matches
* Nested field access on Map columns uses subscript notation: `column['key']`
* Nested field access on JSON/String columns uses `JSONExtractString`
* A default time range and limit is automatically applied
* Results are ordered by timestamp in descending order
For example, this search:
```plaintext
level="error" and log_attributes.user_id="12345"
```
Gets converted to (for a table with `log_attributes` as a Map column):
```sql
SELECT *
FROM logs.app
WHERE (`level` = 'error') AND (`log_attributes`['user_id'] = '12345')
AND timestamp BETWEEN toDateTime('2025-04-07 14:20:42', 'UTC') AND toDateTime('2025-04-07 14:25:42', 'UTC')
ORDER BY timestamp DESC
LIMIT 100
```
And with the pipe operator:
```plaintext
level="error" | timestamp level body
```
Generates:
```sql
SELECT `timestamp`, `level`, `body`
FROM logs.app
WHERE `level` = 'error'
AND timestamp BETWEEN toDateTime('2025-04-07 14:20:42', 'UTC') AND toDateTime('2025-04-07 14:25:42', 'UTC')
ORDER BY timestamp DESC
LIMIT 100
```
### VictoriaLogs
[Section titled “VictoriaLogs”](#victorialogs)
For VictoriaLogs sources, the same LogchefQL expression compiles to LogsQL.
For example:
```text
level="error" and service="payments" | _msg service level
```
Compiles to:
```text
(level:="error") AND (service:="payments") | fields _time, _msg, service, level
```
Logchef applies the selected time range separately when executing LogsQL queries.
## Native Mode
[Section titled “Native Mode”](#native-mode)
For advanced queries that go beyond LogchefQL’s capabilities, you can switch to the datasource’s **native mode** in the query editor:
* **SQL** for ClickHouse
* **LogsQL** for VictoriaLogs
Native mode gives you direct access to backend-specific capabilities, including:
* ClickHouse aggregations (`COUNT`, `SUM`, `AVG`, etc.)
* VictoriaLogs-specific LogsQL pipes and processing operators
* Subqueries
* Joins
* Custom functions
* Complex expressions
In SQL mode, your query executes exactly as written. Time range and limit controls are disabled since you have full control over the SQL.
## Tips for Effective Queries
[Section titled “Tips for Effective Queries”](#tips-for-effective-queries)
1. **Start specific, then broaden**: Begin with specific conditions and remove filters to expand results
2. **Use parentheses for complex logic**: `(a or b) and c` is clearer than relying on operator precedence
3. **Use nested field access**: Don’t flatten your logs. Query them directly
4. **Use the pipe operator**: Select only the fields you need for faster queries
5. **Switch to SQL mode**: For aggregations and advanced analysis
## Next steps
[Section titled “Next steps”](#next-steps)
* See [Query Examples](/guide/examples) for LogchefQL patterns applied to real scenarios
* Review the [Query Interface](/user-guide/query-interface) for time controls and result views
* Try the [Field Values Sidebar](/features/field-sidebar) to build filters without typing
# VictoriaLogs windowed search
> Settings, progress, pagination, and limits for windowed searches on large VictoriaLogs sources.
Windowed search is an opt-in Explorer mode for VictoriaLogs sources. The source form has an **Enable windowed search** option. ClickHouse sources and VictoriaLogs sources with this option disabled keep the standard query path.
## Search behavior
[Section titled “Search behavior”](#search-behavior)
Logchef divides the selected time range into windows and searches newest first. Partial results arrive as each window completes. The page stops at the selected row limit, and **Load older** continues the same query and fixed time range. Parallel windows still appear in newest-first order.
Filter-only LogchefQL and native LogsQL queries use this mode. Queries with pipes use the standard path so their ordering and aggregations retain their meaning. Live Tail uses its existing streaming path.
The stream picker sends exact stream filters separately from the query text. **Select all shown** selects the displayed values. **Clear** removes the picker restriction. The source’s immutable scope and tenant apply to every request.
## Settings
[Section titled “Settings”](#settings)
The source form and provisioning use the same settings:
| Setting | Default | Allowed values | Effect |
| -------------------------- | ------- | -------------------- | ------------------------------------------------------------------------------ |
| `enabled` | `false` | `true`, `false` | Enables windowed search. |
| `max_window_seconds` | `10800` | `60` to `86400` | Maximum duration of one window, in seconds. |
| `concurrency` | `2` | `1` to `8` | Shared per-source limit for window search, count, and picker requests. |
| `schema_lookback_seconds` | `300` | `60` to `86400` | Recent interval used to discover field names, in seconds. |
| `sidebar_lookback_seconds` | `900` | `60` to `10800` | Recent interval used to discover stream fields and sidebar values, in seconds. |
| `sidebar_values_cap` | `10000` | `100` to `100000` | Bounds sidebar value candidates. The reported distinct count remains exact. |
| `histogram_enabled` | `true` | `true`, `false` | Controls chart visibility. Disabling it retains background counts and totals. |
| `stream_fields` | `[]` | Nonempty field names | Configures picker fields. An empty list enables automatic discovery. |
Missing settings use their defaults. Zero-valued numeric settings also use the defaults. Sources without the optimizer keep the standard 24-hour schema lookback. Fields absent from the recent schema interval can be missing from the field list.
This block belongs under a VictoriaLogs source’s connection in [provisioning](/getting-started/provisioning):
```toml
[sources.connection.optimizer]
enabled = true
max_window_seconds = 10800
concurrency = 2
schema_lookback_seconds = 300
sidebar_lookback_seconds = 900
sidebar_values_cap = 10000
histogram_enabled = true
stream_fields = ["service"]
```
## Search and count coverage
[Section titled “Search and count coverage”](#search-and-count-coverage)
**Stop** cancels the active search and counts. **Skip to next window** leaves a visible gap and continues to older windows. Failed and skipped windows have individual retry controls. A row larger than the response byte limit fails its window with a size-limit message.
When the first page contains every matching row, Logchef builds the histogram from those rows. Otherwise, background counts cover the entire selected range. The count coverage strip distinguishes counted, pending, and failed windows. Retrying a failed count replaces that window’s contribution. **Retry failed counts** retries the failed windows in sequence and keeps completed counts. **Stop** cancels the current retry and leaves the remaining windows available for retry. Expand **Show failed count windows** to retry one window.
Results can be available while counts are still running. A partial total covers only the counted windows. Disabling the chart does not disable those counts. Histogram buckets use the selected timezone offset at the range start, matching the standard histogram. A range across a daylight-saving transition uses that same offset throughout.
## Pagination and limits
[Section titled “Pagination and limits”](#pagination-and-limits)
Each page first finds its timestamp boundary with a time-only query. Logchef then sorts complete rows within that shorter range. Cursors record the last timestamp and the number of rows already returned at that timestamp. For unchanged data, timestamp ties and identical duplicate rows remain distinct and appear exactly once.
* A search can contain at most 4,096 windows. Shorten the selected range or increase `max_window_seconds` if it exceeds this limit.
* Very large groups with one timestamp remain expensive to sort.
* Some VictoriaLogs versions can return a boundary that is too recent. A short, untruncated page then triggers one full-window reread, which can be expensive.
* VictoriaLogs has no snapshot isolation across requests. Late ingestion and retention changes can affect later pages.
* Source, filter, and time-range changes require a new search. Cursor formats can also change on upgrade, so existing searches must be rerun.
For a large source, smaller windows bound each request’s time range. Lower concurrency reduces simultaneous work. Full-range background counts can still take substantially longer than the first page.
# Integrations
> How to get logs into ClickHouse or VictoriaLogs so Logchef can query them — shippers, schemas, and the CLI/MCP tooling.
Logchef is a query and control plane for logs that already live in ClickHouse or VictoriaLogs — it doesn’t collect or ship logs itself. Getting logs in front of Logchef is a three-step pipeline:
1. **Collect** — an agent (Vector, the OpenTelemetry Collector) reads logs from your services, files, containers, or cluster
2. **Store** — the agent writes rows into a ClickHouse table (or a VictoriaLogs stream)
3. **Explore** — you point a Logchef source at that table and query it with LogchefQL, SQL, or LogsQL
The guides below cover each collection path, how to shape the ClickHouse schema, and the tools (CLI, MCP server) for working with the data once it’s there.
## Shipping Logs
[Section titled “Shipping Logs”](#shipping-logs)
* [Shipping Logs with Vector](/integration/vector) — general-purpose log pipeline: syslog, files, Docker, journald
* [OpenTelemetry Collector](/integration/otel-collector) — the `clickhouseexporter` and the `otel_logs` schema
* [Kubernetes Logs](/integration/kubernetes) — DaemonSet collection with the Collector or Vector
* [Docker Logs](/integration/docker) — Vector’s `docker_logs` source against the Docker socket
* [Shipping NGINX Logs to ClickHouse](/tutorials/nginx-logs) — a worked example with a purpose-built schema
* [Using VictoriaLogs with Logchef](/tutorials/victorialogs) — connect a VictoriaLogs datasource instead of ClickHouse
## Schema
[Section titled “Schema”](#schema)
* [Schema Design](/integration/schema-design) — field types, codecs, and indexing for fast, storage-efficient queries
## Querying the Data
[Section titled “Querying the Data”](#querying-the-data)
* [Logchef CLI](/integration/cli) — query logs from the terminal, built for scripting and quick investigations
* [MCP Server](/integration/mcp-server) — connect AI coding assistants to Logchef over the Model Context Protocol
## Next steps
[Section titled “Next steps”](#next-steps)
* New to Logchef? Start with [Quick Start](/getting-started/quickstart)
* Already have logs in ClickHouse? Jump to [Query Interface](/user-guide/query-interface) and [Search Syntax](/guide/search-syntax)
# Agent Setup
> Connect Claude Code, Codex, Cursor, Claude.ai, and ChatGPT to Logchef. Use the CLI for a read-only setup preview, or the built-in MCP endpoint with OAuth.
An agent can use Logchef in two ways:
* **The CLI.** The agent runs `logchef` commands in a terminal. Refer to [Run the preview](#run-the-preview).
* **The MCP endpoint.** The agent calls tools over the [Model Context Protocol](/integration/mcp-server). Refer to [Connect over MCP](#connect-over-mcp).
## Run the preview
[Section titled “Run the preview”](#run-the-preview)
`logchef agent setup` prints the steps to use Logchef from a coding agent such as Claude Code, Codex, or Cursor. It is a preview. It does not change your agent configuration, sign you in, or open a browser.
## Run the preview
[Section titled “Run the preview”](#run-the-preview-1)
```bash
logchef agent setup
```
The command prints:
* The instance it resolved (from `--context`, `--server`, or your current context). With no server configured, commands show the placeholder ``.
* The results of [`logchef doctor`](/integration/cli/#doctor): config, connectivity, token, and defaults.
* The steps to run: sign in with `logchef auth`, verify with `logchef doctor --json`, and read the version-matched guide with `logchef skills get core`. If the server does not offer [Logchef OAuth](/getting-started/configuration#logchef-oauth), the sign-in step tells you to set `LOGCHEF_AUTH_TOKEN` to an API token instead.
The server URL must be a plain `http` or `https` URL. The command rejects URLs that contain a username, password, query string, or fragment.
## Structured output
[Section titled “Structured output”](#structured-output)
Use `--output json` (or `jsonl`) when an agent or script runs the command. Data goes to stdout. Notes go to stderr.
```bash
logchef agent setup --host claude-code --output json | jq '.steps[].command'
```
```json
{
"mode": "preview",
"mutates": false,
"instance": { "context": "prod", "server_url": "https://logs.example.com" },
"checks": [{ "check": "Server reachable", "status": "ok", "detail": "Logchef 2.0.0" }],
"steps": [{ "id": "auth", "description": "...", "command": "logchef auth --server https://logs.example.com" }]
}
```
The command exits `0` even when a check fails, because a preview reports state. Read `checks[].status` (`ok`, `warn`, `fail`) to decide what to fix.
## Hosts
[Section titled “Hosts”](#hosts)
`--host` accepts `claude-code`, `codex`, `cursor`, or `chatgpt`. The steps are the same for the first three. ChatGPT connects through its remote app, so this command prints no steps for `chatgpt`. Refer to [ChatGPT](#chatgpt).
## Use the bundled guide
[Section titled “Use the bundled guide”](#use-the-bundled-guide)
Point your agent at the CLI instead of copying syntax into prompts. `logchef skills get core` prints usage, LogchefQL, SQL, and LogsQL guidance that matches the installed binary. See [Skills](/integration/cli/#skills).
## Connect over MCP
[Section titled “Connect over MCP”](#connect-over-mcp)
Logchef serves MCP at `https://logchef.example.com/mcp`. Replace the host with your instance. The agent signs in with OAuth. There is no API token to copy, and no extra process to run.
Before you start:
* The Logchef operator must enable OAuth. Refer to [Logchef OAuth](/getting-started/configuration#logchef-oauth).
* The instance must be reachable from the machine that runs the agent. For Claude.ai and ChatGPT, it must be reachable from the internet over HTTPS.
Every agent connects with a client ID that Logchef knows:
* **Local agents** run on your machine and receive the OAuth callback on a local port. Claude Code, Codex, and Cursor desktop use the built-in client ID `logchef-mcp`. You need no server configuration for it.
* **Hosted agents** run in a vendor’s cloud. Claude.ai, Claude Desktop connectors, and ChatGPT need a client that the operator adds to the server config with the exact callback URL of the host.
### Claude Code
[Section titled “Claude Code”](#claude-code)
```bash
claude mcp add --transport http --client-id logchef-mcp logchef https://logchef.example.com/mcp
```
Then run `/mcp` in Claude Code, choose `logchef`, and sign in. The browser opens the Logchef consent page.
### Codex
[Section titled “Codex”](#codex)
```bash
codex mcp add logchef --url https://logchef.example.com/mcp --oauth-client-id logchef-mcp
codex mcp login logchef
```
### Cursor desktop
[Section titled “Cursor desktop”](#cursor-desktop)
Add the server to `mcp.json`:
```json
{
"mcpServers": {
"logchef": {
"url": "https://logchef.example.com/mcp",
"auth": {
"CLIENT_ID": "logchef-mcp"
}
}
}
}
```
Cursor receives the callback at `http://localhost:8787/callback`. The `logchef-mcp` client accepts that address.
### Claude.ai and Claude Desktop
[Section titled “Claude.ai and Claude Desktop”](#claudeai-and-claude-desktop)
The operator adds a web client to the Logchef config:
```toml
[auth.oauth]
enabled = true
[[auth.oauth.clients]]
id = "claude"
name = "Claude"
redirect_uris = ["https://claude.ai/api/mcp/auth_callback"]
```
Then add a custom connector with the server URL `https://logchef.example.com/mcp`. In the connector’s advanced settings, set **OAuth Client ID** to `claude`. Leave the client secret empty. The client is public and uses PKCE.
### ChatGPT
[Section titled “ChatGPT”](#chatgpt)
ChatGPT connects from OpenAI’s servers, so your Logchef must be reachable from the internet over HTTPS, and the operator must register ChatGPT as a client first:
```toml
[auth.oauth]
enabled = true
[[auth.oauth.clients]]
id = "chatgpt"
name = "ChatGPT"
redirect_uris = ["https://chatgpt.com/connector_platform_oauth_redirect"]
```
Then, in ChatGPT on the web:
1. Open **Plugins**, choose **Add**, then **Add custom MCP server**.
2. Name it `Logchef` and set the MCP server URL to `https://logchef.example.com/mcp`.
3. Choose **OAuth** as the authentication, open the advanced OAuth settings, and set the client ID to `chatgpt`. Leave the client secret empty. ChatGPT discovers the authorization server and shows the callback `https://chatgpt.com/connector_platform_oauth_redirect`, which must match the config above.
4. Create the connection. ChatGPT opens Logchef: sign in if needed, check that the consent page says **Allow ChatGPT to access Logchef?** and returns to `chatgpt.com`, then approve.
Ask, for example, “Using Logchef, find errors in the last hour and open an investigation”. ChatGPT lists your sources, reads the schema, runs the query, and opens the investigation panel in the conversation, where you can change the filter, select a histogram interval or rows, and compare with the previous window.
To disconnect, revoke ChatGPT under **Settings → Connected apps** in Logchef.
### Other hosts
[Section titled “Other hosts”](#other-hosts)
Any MCP client that supports OAuth with a pre-registered client ID can connect:
* A client that receives the callback on a loopback address (`localhost`, `127.0.0.1`, or `[::1]`, any port, path `/callback`) uses `logchef-mcp`.
* A client that runs in the cloud needs a `[[auth.oauth.clients]]` entry with its exact callback URL. Matching is exact. Copy the URL from the host’s connector settings.
Logchef does not support dynamic client registration or client ID metadata documents.
### Check the connection
[Section titled “Check the connection”](#check-the-connection)
Ask the agent to call `get_teams`. It returns the teams you belong to. To remove access, open **Settings → Connected apps** in Logchef.
The agent can use the tools that the [MCP Server](/integration/mcp-server#available-tools) page lists.
# Logchef CLI
> Query ClickHouse and VictoriaLogs logs from the terminal with the Logchef CLI, built for scripting and quick investigations.
A Rust CLI for querying logs from the terminal. Supports LogchefQL across supported sources, raw native queries (SQL for ClickHouse, LogsQL for VictoriaLogs), syntax highlighting (via [tailspin](https://github.com/bensadeh/tailspin)), multi-context management (dev/staging/prod), and browser sign-in through Logchef OAuth.
## Quick Start
[Section titled “Quick Start”](#quick-start)
```bash
# 1. Build the CLI
cd logchef/cli && cargo build --release
# 2. Add to PATH (or copy to /usr/local/bin)
export PATH="$PATH:$(pwd)/target/release"
# 3. Authenticate (auto-creates context from hostname)
logchef auth --server https://logs.example.com
# 4. Rename context to something friendly
logchef config rename logs.example.com prod
# 5. Set defaults so you don't need --team/--source every time
logchef config set team "my-team"
logchef config set source "nginx-logs"
# 6. Query logs
logchef query 'level="error"' --since 1h
```
Tip: Discover teams and sources with:
```bash
logchef teams
logchef sources --team "production"
logchef schema --team "production" --source "nginx-logs"
```
Copy CLI Command from Web UI
In the Logchef web UI, click the terminal icon (next to the share button) in the explore view to copy the equivalent CLI command for your current query. This is a quick way to transition from the web UI to the terminal.
## Installation
[Section titled “Installation”](#installation)
### Pre-built Binaries (Recommended)
[Section titled “Pre-built Binaries (Recommended)”](#pre-built-binaries-recommended)
Download the latest CLI release for your platform from [GitHub Releases](https://github.com/mr-karan/logchef/releases?q=cli\&expanded=true).
| Platform | File |
| ------------------- | ------------------------------------------------- |
| Linux x86\_64 | `logchef-cli__linux-x86_64-musl.tar.gz` |
| Linux ARM64 | `logchef-cli__linux-aarch64-musl.tar.gz` |
| macOS Apple Silicon | `logchef-cli__macos-aarch64.tar.gz` |
| macOS Intel | `logchef-cli__macos-x86_64.tar.gz` |
| Windows x86\_64 | `logchef-cli__windows-x86_64.zip` |
Grab the latest version tag from the [CLI releases page](https://github.com/mr-karan/logchef/releases?q=cli\&expanded=true) (e.g. `0.2.1`), set it once, then download:
```bash
# Set to the latest version from the releases page above
CLI_VERSION="0.2.1"
# Linux x86_64
curl -LO "https://github.com/mr-karan/logchef/releases/download/cli-v${CLI_VERSION}/logchef-cli_${CLI_VERSION}_linux-x86_64-musl.tar.gz"
tar xzf logchef-cli_${CLI_VERSION}_linux-x86_64-musl.tar.gz
sudo mv logchef /usr/local/bin/
# macOS Apple Silicon
curl -LO "https://github.com/mr-karan/logchef/releases/download/cli-v${CLI_VERSION}/logchef-cli_${CLI_VERSION}_macos-aarch64.tar.gz"
tar xzf logchef-cli_${CLI_VERSION}_macos-aarch64.tar.gz
sudo mv logchef /usr/local/bin/
```
Match the CLI to your server
Run `logchef doctor` after installing to confirm the CLI and server versions line up. A mismatch is a warning, not a hard failure.
### From Source
[Section titled “From Source”](#from-source)
If you prefer to build from source (requires [Rust](https://rustup.rs/)):
```bash
# Clone the repository
git clone https://github.com/mr-karan/logchef.git
cd logchef/cli
# Build the release binary
cargo build --release
# The binary is at cli/target/release/logchef
# Copy to your PATH:
sudo cp target/release/logchef /usr/local/bin/
```
### Using Just
[Section titled “Using Just”](#using-just)
If you have [just](https://github.com/casey/just) installed:
```bash
# Build release binary
just build-cli
# Build debug binary (faster compilation for testing)
just build-cli-debug
# Install to ~/.cargo/bin (must be in PATH)
just install-cli
```
### Verify Installation
[Section titled “Verify Installation”](#verify-installation)
```bash
logchef --version
logchef --help
```
## Authentication
[Section titled “Authentication”](#authentication)
The CLI supports two authentication methods: browser sign-in through Logchef OAuth, and API tokens. Use browser sign-in on your own machine. Use API tokens for CI and other automation.
### Server Prerequisite (Logchef OAuth)
[Section titled “Server Prerequisite (Logchef OAuth)”](#server-prerequisite-logchef-oauth)
Browser sign-in needs [Logchef OAuth](/getting-started/configuration#logchef-oauth) on the server:
```toml
[server]
public_url = "https://logs.example.com"
[auth.oauth]
enabled = true
```
The `logchef-cli` client is built in. You do not register it with your identity provider, and the CLI no longer needs `oidc.cli_client_id`. If the server does not offer OAuth, `logchef auth` stops with an error and tells you to use an API token.
The server URL that you give to the CLI must equal `server.public_url`. If it differs, the CLI prints the correct `--server` value.
### Browser-Based Login
[Section titled “Browser-Based Login”](#browser-based-login)
For interactive use, sign in through your browser:
```bash
logchef auth
```
The CLI opens your browser at the Logchef consent page. Sign in to Logchef if needed, then choose **Approve**. The CLI receives the result on a loopback address (`127.0.0.1`, random port) and saves the grant to your config file. The CLI asks for read access to your Logchef data. It does not get write access or admin access.
The access token lasts 10 minutes. The CLI refreshes it when needed. The refresh token lasts 30 days. You can revoke the sign-in at any time in **Settings → Connected apps**.
The CLI prints the sign-in URL on stderr. It opens a browser only when it runs in a terminal and `CI` is not set. Data commands such as `query` never open a browser.
#### Remote machines and `--no-browser`
[Section titled “Remote machines and --no-browser”](#remote-machines-and---no-browser)
On a machine with no browser, such as an SSH session, use `--no-browser`. The CLI prints the URL and does not try to open it:
```bash
logchef auth --no-browser
```
After you approve, the browser must reach the CLI’s loopback listener on the remote machine. Opening the URL on your workstation does not work by itself. The sign-in URL has a `redirect_uri` parameter, such as `http://127.0.0.1:41000/callback`. Forward that port from your workstation, then open the printed URL in your local browser:
```bash
ssh -L 41000:127.0.0.1:41000 user@remote-host
```
Replace `41000` with the port in `redirect_uri`. If you cannot forward a port, use an [API token](#api-token-authentication).
```bash
# Check authentication status (hits the server)
logchef auth --status
# Print the active context, server URL, and token source (offline — no API call)
logchef auth current
# Log out (revoke the sign-in on the server and clear it locally)
logchef auth --logout
```
`auth --status` shows the user, the method, the scopes, and the expiry. `auth --logout` revokes the grant at the server first. If the server cannot be reached, it still removes the local credential, exits with status 1, and tells you to revoke the grant in **Settings → Connected apps**.
`auth current` is the offline counterpart to `auth --status` and `whoami`. It tells you which server + token a subsequent command will use, without making a network call:
```text
context: prod
server: https://logs.example.com
token: Logchef OAuth (from config, renewed automatically)
```
When the token comes from `--token` / `LOGCHEF_AUTH_TOKEN`, the line reports the source but omits an expiry (the CLI doesn’t validate or parse externally-supplied tokens). Useful for CI / bot debugging when an API call fails and you want to verify the credential is actually picked up before troubleshooting further.
#### When the sign-in expires
[Section titled “When the sign-in expires”](#when-the-sign-in-expires)
If a refresh fails, because someone revoked the grant or the 30-day refresh window ended, the command exits with an `auth_required` error. With `--output json` or `jsonl`, the CLI prints one JSON object on stdout:
```json
{
"error": {
"type": "auth_required",
"message": "...",
"fix": "logchef auth --context prod"
}
}
```
Run the command in `fix` to sign in again. A script or agent can read `error.type` and `error.fix` instead of parsing text. The text error still goes to stderr.
### API Token Authentication
[Section titled “API Token Authentication”](#api-token-authentication)
For CI, scripts, and other automation where no one can approve a browser prompt, use an API token. A token passed with `--token` or `LOGCHEF_AUTH_TOKEN` takes precedence over a saved sign-in.
```bash
# Set token via environment variable
export LOGCHEF_AUTH_TOKEN="logchef_1_abc123..."
logchef query ""
# Or pass token as argument
logchef --token "logchef_1_abc123..." query ""
# Or save to config file
logchef config set auth.token "logchef_1_abc123..."
```
Generate API tokens from the Logchef web UI under your profile settings, or see [Service Tokens](/features/service-tokens) for non-login automation accounts.
## Command Reference
[Section titled “Command Reference”](#command-reference)
Works on both engines
`query`, `sql`, `tail`, `find`, `explain`, `fields`, and `histogram` all run against ClickHouse **and** VictoriaLogs sources. LogchefQL (`query`, `tail`) compiles to whichever language the source speaks; `sql` sends ClickHouse SQL or LogsQL verbatim; `explain` shows exactly what a filter compiles to. For a VictoriaLogs walkthrough, see the [VictoriaLogs tutorial](/tutorials/victorialogs/).
### Query Logs
[Section titled “Query Logs”](#query-logs)
The `query` command runs LogchefQL queries from your terminal.
LogchefQL compiles to the selected source’s native query language:
* ClickHouse sources compile to SQL
* VictoriaLogs sources compile to LogsQL
```bash
logchef query 'level="error" and service="api"' --since 1h
```
#### Options
[Section titled “Options”](#options)
| Option | Shorthand | Description | Default |
| ------------------------- | --------- | ------------------------------------------------------------------------ | ------------- |
| `--team` | `-t` | Team name (or ID) | (from config) |
| `--source` | `-S` | Source name, source ID, or ClickHouse `database.table_name` | (from config) |
| `--since` | `-s` | Time range (e.g., “15m”, “1h”, “24h”) | “15m” |
| `--from` | | Absolute start time (ISO 8601) | |
| `--to` | | Absolute end time (ISO 8601) | |
| `--limit` | `-l` | Maximum number of results | 100 |
| `--output` | | Output format (`text`, `json`, `jsonl`, `json-flat`, `table`, `msg`) | `text` |
| `--no-highlight` | | Disable syntax highlighting (auto-disabled when piped) | `false` |
| `--no-timestamp` | | Hide timestamp from text output | `false` |
| `--show-sql`, `--explain` | | Trace the server-generated backend query on stderr (continues executing) | `false` |
| `--dry-run` | | Print the server-generated backend query to stdout and exit | `false` |
#### Interactive Mode
[Section titled “Interactive Mode”](#interactive-mode)
When you run `logchef query` without specifying team, source, or query, and you’re in a terminal, the CLI enters interactive mode:
```bash
# Launch interactive mode
logchef query
# Prompts:
# ? Select team: [production, staging, dev]
# ? Select source: [nginx-logs, app-logs, api-logs]
# ? LogChefQL query: level="error"
```
This is useful for quick exploration without remembering exact team/source names.
#### Query Examples
[Section titled “Query Examples”](#query-examples)
```bash
# Get all logs from the last 15 minutes
logchef query "" --team "production" --source "nginx-logs"
# Use database.table_name format for ClickHouse sources (copy from UI)
logchef query "" --team "production" --source "logs.app"
# Filter by field value
logchef query 'status=500' --team "production" --source "nginx-logs"
# Multiple conditions (AND)
logchef query 'method="POST" and status=403' --team "production" --source "nginx-logs"
# Search within a time range
logchef query 'level="error"' --since 1h --limit 50
# Print only the message column
logchef query 'level="error"' --output msg --limit 5
# Hoist JSON-shaped msg fields to top-level JSON rows
logchef query 'level="error"' --output json-flat --limit 5
# Hide timestamp from output
logchef query 'level="error"' --no-timestamp
# Output as JSON (returns object with logs, stats, columns)
logchef query 'status=500' --output json | jq '.logs[] | .host'
# Output as JSON Lines (one JSON object per line, great for jq)
logchef query "" --output jsonl | jq '.msg'
# JSON output is jq-friendly - stats are included in the object
logchef query "" --output json | jq '{count: .count, time_ms: .stats.execution_time_ms}'
# Trace the generated backend query on stderr while still running
logchef query 'method="GET"' --show-sql # or: --explain
# Print the generated backend query to stdout and exit (no results returned)
logchef query 'method="GET"' --dry-run
# Use absolute time range
logchef query "" --from "2026-01-14T00:00:00Z" --to "2026-01-14T12:00:00Z"
```
### Raw Native Queries
[Section titled “Raw Native Queries”](#raw-native-queries)
The `sql` command lets you execute the selected source’s native query language directly. Use SQL for ClickHouse sources and LogsQL for VictoriaLogs sources. Unlike `query`, you have full control over the backend query.
```bash
logchef sql "SELECT * FROM logs.app WHERE level='error' LIMIT 10"
logchef sql 'level:="error" | fields _time, _msg, service'
```
#### Options
[Section titled “Options”](#options-1)
| Option | Shorthand | Description | Default |
| ------------------------- | --------- | ---------------------------------------------------------------------------------- | ------------- |
| `--team` | `-t` | Team name (or ID) | (from config) |
| `--source` | `-S` | Source name, native target (`database.table_name` or VictoriaLogs base URL), or ID | (from config) |
| `--since` | `-s` | Apply a relative time range (e.g., “15m”, “1h”, “24h”) | |
| `--from` | | Apply an absolute start time (`YYYY-MM-DD HH:MM:SS`) | |
| `--to` | | Apply an absolute end time (`YYYY-MM-DD HH:MM:SS`) | |
| `--timeout` | | Query timeout in seconds | 30 |
| `--output` | | Output format (`text`, `json`, `jsonl`, `json-flat`, `table`, `csv`, `msg`) | `text` |
| `--no-highlight` | | Disable syntax highlighting (auto-disabled when piped) | `false` |
| `--no-timestamp` | | Hide timestamp from text output | `false` |
| `--show-sql`, `--explain` | | Trace the resolved SQL on stderr (continues executing) | `false` |
| `--dry-run` | | Print the resolved SQL to stdout and exit without running it | `false` |
#### Interactive Mode
[Section titled “Interactive Mode”](#interactive-mode-1)
Similar to `query`, the `sql` command supports interactive mode:
```bash
# Launch interactive mode
logchef sql
# Prompts:
# ? Select team: [production, staging, dev]
# ? Select source: [nginx-logs, app-logs, api-logs]
# ? Raw query: SELECT * FROM logs.app LIMIT 10
```
#### Native Query Examples
[Section titled “Native Query Examples”](#native-query-examples)
```bash
# ClickHouse SQL with time filter
logchef sql "SELECT * FROM logs.app WHERE _timestamp > now() - INTERVAL 1 HOUR LIMIT 100"
# ClickHouse aggregation query
logchef sql "SELECT level, count() as cnt FROM logs.app WHERE _timestamp > now() - INTERVAL 1 DAY GROUP BY level"
# VictoriaLogs LogsQL query
logchef sql 'level:="error" | fields _time, _msg, service'
# Let the CLI add the source timestamp range
logchef sql "SELECT level, count() AS count FROM logs.app GROUP BY level" --since 1h
# Place the time expressions explicitly
logchef sql "SELECT * FROM logs.app WHERE _timestamp BETWEEN __START__ AND __END__" --since 1h
# Read a native query from stdin (useful for complex queries)
cat query.sql | logchef sql -
# Or use heredoc
logchef sql - <<'EOF'
SELECT
toStartOfHour(_timestamp) as hour,
count() as requests,
countIf(status >= 500) as errors
FROM logs.nginx
WHERE _timestamp > now() - INTERVAL 24 HOUR
GROUP BY hour
ORDER BY hour
EOF
# Output as JSON
logchef sql "SELECT * FROM logs.app LIMIT 5" --output json
# Print only msg, or the first selected column when msg is absent
logchef sql "SELECT msg FROM logs.app LIMIT 5" --output msg
# Trace the resolved SQL on stderr while still running the query
logchef sql "SELECT count() FROM logs.app WHERE level='error'" --since 1h --explain
# Print the resolved SQL and exit (useful for piping to another tool)
logchef sql "SELECT count() FROM logs.app WHERE level='error'" --since 1h --dry-run
# Pipe to jq for processing
logchef sql "SELECT host, count() as cnt FROM logs.app GROUP BY host" --output jsonl | jq -s 'sort_by(.cnt) | reverse'
```
When to use `sql` vs `query`
* Use `query` (LogchefQL) for quick filtering across supported sources with convenient time flags (`--since 1h`)
* Use `sql` when you need full control over the source’s native query language
Auto-injected time predicate
`--since` / `--from` / `--to` work on the top-level SELECT. The CLI walks the SQL skipping string literals, quoted identifiers, and parenthesized subqueries, then injects the predicate before the first top-level `GROUP BY` / `ORDER BY` / `LIMIT` / `HAVING` / `SETTINGS` / `FORMAT`. For CTEs (`WITH ... AS (...)`) or any case where you want full control, use the `__START__` / `__END__` placeholders explicitly.
### Explain a Query
[Section titled “Explain a Query”](#explain-a-query)
The `explain` command translates a LogchefQL filter into the source’s native query language and validates it **without running anything**. It’s the go-to for “what will this actually run?” and “is this filter valid?” — the translation happens server-side, but no logs are read.
For ClickHouse sources it prints the generated SQL; for VictoriaLogs sources it prints the generated LogsQL.
```bash
logchef explain 'level="error" and service="api"' -t production -S app-logs
```
#### Options
[Section titled “Options”](#options-2)
| Option | Shorthand | Description | Default |
| ---------- | --------- | ----------------------------------------- | ------------- |
| `--team` | `-t` | Team name (or ID) | (from config) |
| `--source` | `-S` | Source name, `database.table_name`, or ID | (from config) |
| `--output` | | Output format (`text`, `json`, `jsonl`) | `text` |
#### Explain Examples
[Section titled “Explain Examples”](#explain-examples)
```bash
# See the ClickHouse SQL / LogsQL a filter compiles to
logchef explain 'status>=500'
# Validate a filter's syntax in a script (exit stays 0; check the JSON)
logchef explain 'status>=500' --output json | jq '.valid'
```
`explain` vs `--explain`/`--show-sql`
`explain` is a translate-and-validate step that **never executes**. The `--explain` / `--show-sql` flags on `query` and `sql` trace the generated backend query on stderr but **still run** it. Use `explain` when you only want to see or check the query; use the flags when you want the results and the query.
### Fields
[Section titled “Fields”](#fields)
The `fields` command is for field discovery. With no argument it lists the source’s fields and types; pass a field name to list its observed values (with counts) over a lookback window.
```bash
# List every field in a source
logchef fields -t production -S app-logs
# Top observed values for `service` in the last hour
logchef fields service --since 1h
```
#### Options
[Section titled “Options”](#options-3)
| Option | Shorthand | Description | Default |
| ---------- | --------- | --------------------------------------------------------------- | -------------------- |
| `--team` | `-t` | Team name (or ID) | (from config) |
| `--source` | `-S` | Source name, `database.table_name`, or ID | (from config) |
| `--since` | `-s` | Lookback window for value enumeration (e.g. “15m”, “1h”, “24h”) | (from config, `15m`) |
| `--limit` | | Max number of values to return (when a field is given) | `20` |
| `--output` | | Output format (`text`, `json`, `jsonl`, `table`) | `text` |
#### Fields Examples
[Section titled “Fields Examples”](#fields-examples)
```bash
# List fields and types
logchef fields
# Top 50 values for `status`, machine-readable
logchef fields status --limit 50 --output jsonl
# What levels have we seen in the last 24h?
logchef fields level --since 24h
```
### Histogram
[Section titled “Histogram”](#histogram)
The `histogram` command buckets log counts over time. In text mode it renders a terminal bar chart; in `json`/`jsonl`/`table` mode it emits the raw buckets for plotting elsewhere. Works against both ClickHouse and VictoriaLogs sources. Pass an optional LogchefQL query to bucket only matching logs, and `--group-by` to break each bucket into the top series.
```bash
logchef histogram 'level="error"' --since 24h -t production -S app-logs
```
#### Options
[Section titled “Options”](#options-4)
| Option | Shorthand | Description | Default |
| ------------ | --------- | --------------------------------------------------------------------------- | -------------------- |
| `--team` | `-t` | Team name (or ID) | (from config) |
| `--source` | `-S` | Source name, `database.table_name`, or ID | (from config) |
| `--since` | `-s` | Relative lookback window (e.g. “15m”, “1h”, “24h”) | (from config, `15m`) |
| `--from` | | Absolute start (`YYYY-MM-DD HH:MM:SS`, effective timezone). Requires `--to` | |
| `--to` | | Absolute end (`YYYY-MM-DD HH:MM:SS`, effective timezone). Requires `--from` | |
| `--interval` | | Bucket size (e.g. “1m”, “5m”, “1h”). `auto` sizes it from the range | `auto` |
| `--group-by` | | Field to break each bucket down by (top 10 series) | |
| `--output` | | Output format (`text`, `json`, `jsonl`, `table`) | `text` |
| `--timeout` | | Query timeout in seconds | `30` |
#### Histogram Examples
[Section titled “Histogram Examples”](#histogram-examples)
```bash
# Error rate over 24h, auto-sized buckets
logchef histogram 'level="error"' --since 24h
# Total volume in 5-minute buckets, broken down by service (top 10)
logchef histogram --since 6h --interval 5m --group-by service
# Machine-readable buckets for plotting elsewhere
logchef histogram 'status>=500' --since 1h --output jsonl
```
Text output looks like:
```text
span 07-15 00:00:00 → 07-16 00:00:00 · bucket 30m
07-15 00:00:00 │████████▍ 1,204
07-15 00:30:00 │██████████████████████████████ 4,417
07-15 01:00:00 │███████▏ 998
...
48 buckets · 82,341 logs · peak 4,417
```
### Source Discovery
[Section titled “Source Discovery”](#source-discovery)
The `find` command searches accessible sources (ClickHouse and VictoriaLogs) for a service, job, host, or message pattern and prints the sources with recent matches.
```bash
logchef find payments-api
logchef find payments-api --team production --since 6h
```
#### Find Options
[Section titled “Find Options”](#find-options)
| Option | Shorthand | Description | Default |
| -------------- | --------- | --------------------------------------- | --------------------------------------- |
| `--team` | `-t` | Restrict discovery to one team | All accessible teams |
| `--source` | `-S` | Restrict discovery to one source | All sources |
| `--since` | `-s` | Lookback window | `24h` |
| `--column` | | Candidate column to search; repeatable | Common service/job/host/message columns |
| `--limit` | | Maximum matching sources to print | `10` |
| `--timeout` | | Per-source query timeout in seconds | `30` |
| `--no-samples` | | Skip the per-column sample fetch | `false` |
| `--output` | | Output format (`text`, `json`, `jsonl`) | `text` |
For each matched source, `find` fires a small follow-up query per matching column to surface sample values:
```text
team=8 source=11 (logs.app) matches=1401245 in 30m columns=job_name,msg
↳ job_name: "payments-api" (1400128), "payments-api-uat" (1117)
↳ msg: "payments-api handled request 0a3f9b…" (sample)
```
Label-shaped columns (`service`, `host`, `job_name`, …) get the top 3 values with counts; free-form text columns (`msg`, `message`, `body`) get a single truncated sample row. Pass `--no-samples` to suppress and get just the summary line. In JSON / JSONL output, samples are included as a `samples: [{column, values: [{value, count?}]}]` field.
Sources that fail to inspect (permissions, schema fetch, or query errors) are silently skipped. The text output reports the skip count on stderr; pass the global `--debug` flag to see per-source diagnostics. If a source consistently times out (e.g. very wide table over a long lookback), raise `--timeout` or narrow with `--since` / `--column`.
### Tail
[Section titled “Tail”](#tail)
The `tail` command follows matching LogchefQL results live until Ctrl-C or `--max-lines` is reached. It streams **natively over Server-Sent Events (SSE)**: the server handles the live push for both backends (polling under the hood for ClickHouse, VictoriaLogs’ native tail for VL), so the ClickHouse-vs-VictoriaLogs difference is invisible to you.
```bash
logchef tail 'service="payments-api" and msg~"error"' -t production -S app-logs
logchef tail 'level="error"' --output jsonl --max-lines 20
```
For environments where the streaming endpoint is unavailable (e.g. a proxy that buffers SSE), pass `--poll` to fall back to the legacy client-side polling loop. Under `--poll`, the CLI repeatedly queries newest-first on `--interval`; `--since`, `--interval`, and `--limit` only apply in this mode (the SSE stream is push-based and always follows from now).
#### Tail Options
[Section titled “Tail Options”](#tail-options)
| Option | Shorthand | Description | Default |
| ---------------- | --------- | --------------------------------------------------------------------------------------------------------------------- | ----------------- |
| `--team` | `-t` | Team name or ID | (from env/config) |
| `--source` | `-S` | Source name, `database.table_name`, or ID | (from env/config) |
| `--poll` | | Use the legacy client-side polling loop instead of the native SSE stream | `false` |
| `--since` | `-s` | Initial lookback window (`--poll` only) | `30s` |
| `--interval` | | Poll interval in seconds (`--poll` only) | `2` |
| `--limit` | | Maximum rows fetched per poll (`--poll` only) | `100` |
| `--max-lines` | | Stop after printing this many rows | |
| `--timeout` | | Query timeout in seconds. Bounds each poll under `--poll`; acts as an idle read timeout (reconnect) on the SSE stream | `30` |
| `--output` | | Output format (`text`, `jsonl`, `msg`) | `text` |
| `--no-highlight` | | Disable syntax highlighting (auto-disabled when piped) | `false` |
| `--no-timestamp` | | Hide timestamp from text output | `false` |
Under `--poll`, if a single poll returns at `--limit`, tail prints a one-shot stderr warning: between polls, more rows may have arrived than fit in one fetch. Raise `--limit` or shrink `--interval` to keep up. The native SSE stream doesn’t have this limit.
Highlighting is auto-disabled when stdout is not a TTY, so `logchef tail '...' | jq` and `... > log.txt` produce clean output without `--no-highlight`. The flag still works as an explicit override.
#### Example Output
[Section titled “Example Output”](#example-output)
When running a query, you’ll see highlighted output with colors:
```text
2026-01-14T07:16:06.149Z host=172.100.86.236 method=PATCH status=410 bytes=45112
2026-01-14T07:16:06.049Z host=156.89.90.123 method=PATCH status=200 bytes=42092
2026-01-14T07:16:05.949Z host=217.33.68.177 method=POST status=403 bytes=10709
```
The highlighting includes:
* **Timestamps** in magenta
* **IP addresses** in cyan
* **URLs** with protocol highlighting
* **Key=value pairs** with dimmed keys
* **Numbers** in cyan
* **Log levels** color-coded (ERROR=red, WARN=yellow, INFO=green, DEBUG=blue)
### Open in Web Explorer
[Section titled “Open in Web Explorer”](#open-in-web-explorer)
The `open` command builds a web explorer URL for the current team/source (and optional query) and opens it in your browser — the reverse of the “copy CLI command” button in the UI. Handy when a terminal investigation is easier to keep digging into visually. Pass `--print` to print the URL instead of launching a browser.
```bash
# Open a filter in the explorer with a relative window
logchef open 'status>=500' -t production -S app-logs --since 1h
# Print the URL instead of opening it
logchef open 'level="error"' --since 15m --print
```
#### Options
[Section titled “Options”](#options-5)
| Option | Shorthand | Description | Default |
| ---------- | --------- | ---------------------------------------------------------------------------- | ------------- |
| `--team` | `-t` | Team name (or ID) | (from config) |
| `--source` | `-S` | Source name, `database.table_name`, or ID | (from config) |
| `--sql` | | Treat the query as a raw native query (ClickHouse SQL / VictoriaLogs LogsQL) | `false` |
| `--since` | `-s` | Relative time range to preselect (ignored if `--from`/`--to` given) | |
| `--from` | | Absolute start (`YYYY-MM-DD HH:MM:SS`, effective timezone). Requires `--to` | |
| `--to` | | Absolute end (`YYYY-MM-DD HH:MM:SS`, effective timezone). Requires `--from` | |
| `--limit` | `-l` | Row limit to preselect | |
| `--print` | | Print the URL instead of opening a browser | `false` |
#### Open Examples
[Section titled “Open Examples”](#open-examples)
```bash
# Hand off a native query to the explorer
logchef open 'SELECT * FROM logs.app WHERE level=' --sql -t production -S app-logs
# Open an absolute-range investigation
logchef open 'recipient~"user@example.com"' \
--from '2026-06-30 00:00:00' --to '2026-06-30 23:59:59'
```
### Saved Queries
[Section titled “Saved Queries”](#saved-queries)
The `saved-queries` command lists and runs saved queries from the Logchef web UI. You can pass a saved-query ID, exact name, or an explorer URL copied from the browser.
```bash
# List all saved queries visible to your account
logchef saved-queries
# Run by numeric ID
logchef saved-queries 14
# Run by pasted explorer URL
logchef saved-queries "https://logs.example.com/logs/explore?team=8&source=11&id=14"
```
#### Options
[Section titled “Options”](#options-6)
| Option | Shorthand | Description | Default |
| ---------------- | --------- | -------------------------------------------------------------------- | --------------------- |
| `--team` | `-t` | Team name or ID | Query’s resolved team |
| `--source` | `-S` | Source name, `database.table_name`, or ID | Query’s source |
| `--limit` | `-l` | Override maximum number of results | From saved query |
| `--var` | `-V` | Set variable value (format: `name=value`) | |
| `--show-sql` | | Print the resolved query without running it | `false` |
| `--output` | | Output format (`text`, `json`, `jsonl`, `json-flat`, `table`, `msg`) | `text` |
| `--no-highlight` | | Disable syntax highlighting | `false` |
| `--no-timestamp` | | Hide timestamp from text output | `false` |
#### Saved Query Examples
[Section titled “Saved Query Examples”](#saved-query-examples)
```bash
# List as JSON
logchef saved-queries --output json | jq '.[] | {id, name, source_name}'
# Run by name
logchef saved-queries "Error Dashboard"
# Substitute variables from the saved query envelope
logchef saved-queries 14 --var service=api --var level=error
# Print only message text
logchef saved-queries 14 --output msg
# Dry-run the stored query text
logchef saved-queries 14 --show-sql
```
### Collections
[Section titled “Collections”](#collections)
The `collections` command lets you list and run saved collections (saved queries) from the Logchef web UI.
```bash
# List all collections for a source
logchef collections --team "production" --source "nginx-logs"
# Run a collection by name
logchef collections "Error Dashboard" --team "production" --source "nginx-logs"
```
#### Options
[Section titled “Options”](#options-7)
| Option | Shorthand | Description | Default |
| ---------------- | --------- | -------------------------------------------------------------------- | ----------------- |
| `--team` | `-t` | Team name (or ID) | (from config) |
| `--source` | `-S` | Source name, `database.table_name`, or ID | (from config) |
| `--since` | `-s` | Override time range (e.g., “15m”, “1h”, “24h”) | (from collection) |
| `--from` | | Override absolute start time (ISO 8601) | |
| `--to` | | Override absolute end time (ISO 8601) | |
| `--limit` | `-l` | Override maximum number of results | (from collection) |
| `--var` | | Set variable value (format: `name=value`) | |
| `--output` | | Output format (`text`, `json`, `jsonl`, `json-flat`, `table`, `msg`) | `text` |
| `--no-highlight` | | Disable syntax highlighting | `false` |
| `--no-timestamp` | | Hide timestamp from text output | `false` |
| `--show-sql` | | Display the generated SQL query | `false` |
#### Interactive Mode
[Section titled “Interactive Mode”](#interactive-mode-2)
When run without arguments, enters interactive mode to select team, source, and collection:
```bash
# Launch interactive mode
logchef collections
# Prompts:
# ? Select team: [production, staging, dev]
# ? Select source: [nginx-logs, app-logs, api-logs]
# ? Select collection: [Error Dashboard, Slow Requests, Daily Summary]
```
#### Collection Examples
[Section titled “Collection Examples”](#collection-examples)
```bash
# List all collections
logchef collections -t "production" -S "nginx-logs"
# ID NAME TYPE DESCRIPTION
# 1 Error Dashboard logchefql Track 5xx errors
# 2 Slow Requests logchefql Requests > 1s
# Run a collection with default settings
logchef collections "Error Dashboard" -t "production" -S "nginx-logs"
# Override time range
logchef collections "Error Dashboard" -t 1 -S 1 --since 1h
# Set variables defined in the collection
logchef collections "Service Logs" --var service=api --var level=error
# Output as JSON
logchef collections "Error Dashboard" --output json | jq '.count'
```
Collections vs Query
Collections are saved queries with predefined settings (time ranges, limits, variables). Use them for repeatable queries you’ve set up in the web UI. Use `query` for ad-hoc exploration.
### Teams
[Section titled “Teams”](#teams)
List teams available to your account:
```bash
logchef teams
```
#### Options
[Section titled “Options”](#options-8)
| Option | Description | Default |
| ---------- | ------------------------------------------------ | ------- |
| `--output` | Output format (`text`, `json`, `jsonl`, `table`) | `text` |
### Whoami
[Section titled “Whoami”](#whoami)
Show the authenticated user and accessible teams:
```bash
logchef whoami
logchef whoami --output json
```
### Sources
[Section titled “Sources”](#sources)
List sources for a team:
```bash
logchef sources --team "production"
```
#### Options
[Section titled “Options”](#options-9)
| Option | Shorthand | Description | Default |
| ---------- | --------- | ------------------------------------------------ | ------------- |
| `--team` | `-t` | Team name (or ID) | (from config) |
| `--output` | | Output format (`text`, `json`, `jsonl`, `table`) | `text` |
### Schema
[Section titled “Schema”](#schema)
Show the schema for a source. If the ClickHouse table has column comments, Logchef exposes them as `description` in JSON output and shows them in the text table.
```bash
logchef schema --team "production" --source "nginx-logs"
```
#### Options
[Section titled “Options”](#options-10)
| Option | Shorthand | Description | Default |
| ---------- | --------- | ------------------------------------------------ | ------------- |
| `--team` | `-t` | Team name (or ID) | (from config) |
| `--source` | `-S` | Source name, `database.table_name`, or ID | (from config) |
| `--output` | | Output format (`text`, `json`, `jsonl`, `table`) | `text` |
### Doctor
[Section titled “Doctor”](#doctor)
The `doctor` command runs a one-shot health check of your setup, so it’s a good first step when something isn’t working. It checks: the config file, current context, server reachability, CLI auth availability, the token and its expiry, whether the CLI and server versions match, and whether your default team/source actually resolve. Each line is `✓` (ok), `⚠` (warning), or `✗` (problem); every warning or problem prints an actionable `→` fix. It exits `0` when there are no problems (warnings are fine) and `1` otherwise.
```bash
logchef doctor
```
#### Options
[Section titled “Options”](#options-11)
| Option | Description | Default |
| -------- | ------------------------------------------------------------------ | ------- |
| `--json` | Emit the checks as a JSON array of `{check, status, detail, hint}` | `false` |
#### Doctor Examples
[Section titled “Doctor Examples”](#doctor-examples)
```bash
# Human-readable health report
logchef doctor
# Machine-readable — surface only failures in CI
logchef doctor --json | jq '.[] | select(.status == "fail")'
# Diagnose a specific server without switching contexts
logchef doctor --server https://logs.example.com
```
### Skills
[Section titled “Skills”](#skills)
The CLI bundles its own usage skill, embedded at build time so its content always matches your installed binary. `skills list` shows what’s available; `skills get core` prints the guide. This is the best way to get usage instructions that match your version — point an agent (or yourself) at it instead of guessing at flags.
```bash
# List the bundled skills
logchef skills list
# Print the core usage guide (LogchefQL / SQL / LogsQL, workflows)
logchef skills get core
# Include every reference file (full syntax reference)
logchef skills get core --full
# Feed the guide to an agent as JSON
logchef skills get core --json
```
For agents
If you’re driving Logchef from an AI agent or script, run `logchef skills get core` first. The output is version-matched to the binary, so the flags and behaviors it describes are guaranteed to exist.
For a read-only walkthrough of connecting a coding agent, see [Agent Setup](/integration/agent-setup/).
### Completions
[Section titled “Completions”](#completions)
Generate a shell completion script for `bash`, `zsh`, `fish`, or `powershell`:
```bash
# Bash (add to ~/.bashrc)
logchef completions bash > /etc/bash_completion.d/logchef
# Zsh (place on your $fpath)
logchef completions zsh > ~/.zfunc/_logchef
# Fish
logchef completions fish > ~/.config/fish/completions/logchef.fish
```
### Configuration
[Section titled “Configuration”](#configuration)
Manage your CLI settings using the `config` command.
```bash
# List all contexts
logchef config list
# Switch to a different context
logchef config use prod
# Show current context configuration
logchef config show
# Set configuration values for current context
logchef config set team 2
logchef config set source 2
logchef config set limit 50
logchef config set since "1h"
# Rename a context
logchef config rename logs.example.com prod
# Delete a context
logchef config delete old-server
```
#### Multi-Context Workflow
[Section titled “Multi-Context Workflow”](#multi-context-workflow)
The CLI supports managing multiple Logchef instances (dev/staging/prod):
```bash
# Authenticate with prod (context auto-created from hostname)
logchef auth --server https://logs.company.com
logchef config rename logs.company.com prod
# Authenticate with dev
logchef auth --server http://localhost:8125
logchef config rename localhost dev
# List contexts
logchef config list
# CONTEXT SERVER AUTH
# * prod https://logs.company.com yes
# dev http://localhost:8125 yes
# Switch contexts
logchef config use dev
logchef query 'level="debug"'
# One-off query to different context
logchef --context prod query 'level="error"'
```
#### Recommended Setup
[Section titled “Recommended Setup”](#recommended-setup)
After authenticating, set your defaults to avoid typing `--team` and `--source` every time:
```bash
# Set defaults using team and source names
logchef config set team "my-team"
logchef config set source "nginx-logs"
# Now you can just run:
logchef query 'level="error"'
```
Source Resolution
The `--source` flag accepts multiple formats:
* **Friendly name**: `"Application Logs"` (case-insensitive)
* **Table reference**: `logs.app` (as shown in UI, case-insensitive)
* **Numeric ID**: `11`
Lookups are cached locally (`~/.cache/logchef/`) for 10 minutes.
## Configuration File
[Section titled “Configuration File”](#configuration-file)
The configuration is stored at `~/.config/logchef/logchef.json`:
```json
{
"current_context": "prod",
"contexts": {
"prod": {
"server_url": "https://logs.example.com",
"timeout_secs": 30,
"token": "logchef_1_...",
"token_expires_at": "2026-02-14T00:00:00Z",
"defaults": {
"team": "production",
"source": "nginx-logs",
"limit": 100,
"since": "15m"
}
},
"dev": {
"server_url": "http://localhost:8125",
"timeout_secs": 30,
"token": "logchef_1_...",
"defaults": {}
}
},
"highlights": {
"custom_keywords": ["MYAPP", "CRITICAL"],
"disable_builtin": false,
"disabled_groups": [],
"custom_regexes": [
{
"pattern": "trace_id=[a-f0-9]+",
"color": "cyan",
"bold": false,
"italic": false
}
]
}
}
```
### Configuration Options
[Section titled “Configuration Options”](#configuration-options)
| Section | Key | Description |
| --------------------------------- | ------------------ | ----------------------------------------------------- |
| `current_context` | Active context | Name of the context to use by default |
| `contexts..server_url` | Server URL | Logchef server address for this context |
| `contexts..timeout_secs` | Timeout | HTTP request timeout in seconds |
| `contexts..defaults.team` | Default team | Team name (or ID) to use when `--team` is omitted |
| `contexts..defaults.source` | Default source | Source name (or ID) to use when `--source` is omitted |
| `contexts..defaults.limit` | Default limit | Number of results when `--limit` is omitted |
| `contexts..defaults.since` | Default time range | Time range when `--since` is omitted |
| `highlights.custom_keywords` | Custom keywords | Words to highlight in magenta |
| `highlights.disable_builtin` | Disable defaults | Turn off built-in log level highlighting |
| `highlights.disabled_groups` | Disabled groups | List of highlighter groups to disable |
| `highlights.custom_regexes` | Custom patterns | Regex patterns with custom colors |
## Syntax Highlighting
[Section titled “Syntax Highlighting”](#syntax-highlighting)
The CLI highlights common log patterns automatically, using [tailspin](https://github.com/bensadeh/tailspin).
### Built-in Highlighting
[Section titled “Built-in Highlighting”](#built-in-highlighting)
| Category | What’s Highlighted | Colors |
| ---------------- | ------------------------ | -------------- |
| **Log Levels** | ERROR, FATAL, CRITICAL | Red (bold) |
| | WARN, WARNING | Yellow |
| | INFO | Green |
| | DEBUG, TRACE | Blue |
| **HTTP Methods** | GET | Green (bold) |
| | POST | Yellow (bold) |
| | PUT, PATCH | Magenta (bold) |
| | DELETE | Red (bold) |
| **Identifiers** | IPs, UUIDs, URLs | Cyan/Blue |
| **Temporal** | Dates, timestamps | Magenta |
| **Data** | Numbers, key=value pairs | Cyan |
| **Booleans** | true, false, null | Cyan |
### Ad-hoc Highlighting
[Section titled “Ad-hoc Highlighting”](#ad-hoc-highlighting)
Highlight specific words on-the-fly without changing your config:
```bash
# Highlight words in specific colors
logchef query "" --highlight red:ERROR,FAIL --highlight green:SUCCESS,OK
# Available colors: red, green, yellow, blue, magenta, cyan, white, black
# Also: bright_red, bright_green, bright_yellow, etc.
```
### Disable Highlighters
[Section titled “Disable Highlighters”](#disable-highlighters)
Turn off specific highlighting groups for cleaner output:
```bash
# Disable date/time and number highlighting
logchef query "" --disable-highlight dates --disable-highlight numbers
# Available groups: dates, numbers, uuids, ips, urls, paths,
# pointers, keyvalue, quotes, json, keywords
```
### Custom Regex Patterns
[Section titled “Custom Regex Patterns”](#custom-regex-patterns)
Add custom regex patterns in your config file:
```json
{
"highlights": {
"custom_regexes": [
{
"pattern": "user_id=(\\d+)",
"color": "cyan",
"bold": true
},
{
"pattern": "request_id=[a-f0-9-]+",
"color": "magenta"
}
]
}
}
```
### Disable All Highlighting
[Section titled “Disable All Highlighting”](#disable-all-highlighting)
The CLI auto-disables ANSI highlighting when stdout is not a TTY, so piping or redirecting just works:
```bash
logchef query "" > logs.txt
logchef tail '...' --output jsonl | jq -r .msg
```
Use `--no-highlight` to opt out explicitly even on an interactive terminal:
```bash
logchef query "" --no-highlight | grep "ERROR"
```
## Output Formats
[Section titled “Output Formats”](#output-formats)
### JSON Format (`--output json`)
[Section titled “JSON Format (--output json)”](#json-format---output-json)
Returns a single JSON object containing logs, stats, and metadata:
```json
{
"logs": [
{ "_timestamp": "2026-01-20T10:30:00Z", "level": "error", "msg": "..." },
{ "_timestamp": "2026-01-20T10:29:59Z", "level": "info", "msg": "..." }
],
"count": 2,
"stats": {
"execution_time_ms": 45,
"rows_read": 2,
"bytes_read": 1024
},
"query_id": "abc123-...",
"generated_sql": "SELECT * FROM ...",
"columns": [
{ "name": "_timestamp", "type": "DateTime64(3)" },
{ "name": "level", "type": "String" }
]
}
```
### JSON Lines Format (`--output jsonl`)
[Section titled “JSON Lines Format (--output jsonl)”](#json-lines-format---output-jsonl)
Each log entry is output as a separate JSON object on its own line:
```jsonl
{"_timestamp":"2026-01-20T10:30:00Z","level":"error","msg":"Connection failed"}
{"_timestamp":"2026-01-20T10:29:59Z","level":"info","msg":"Request completed"}
```
### Smart Output Detection
[Section titled “Smart Output Detection”](#smart-output-detection)
The CLI automatically detects if output is going to a terminal (TTY) or being piped:
* **Terminal**: Shows stats summary (`3 logs | 45ms | 3 rows read`)
* **Piped**: Suppresses stats for clean output to `grep`, `jq`, etc.
```bash
# Stats shown (terminal)
logchef query ""
# Output: [logs...]
# 3 logs | 45ms | 3 rows read
# Stats suppressed (piped)
logchef query "" | grep "error"
# Output: [matching lines only, no stats]
```
## Global Options
[Section titled “Global Options”](#global-options)
The following options can be used with any command:
| Option | Environment Variable | Description |
| ------------------ | ------------------------ | ---------------------------------------------------------------------- |
| `--context` / `-c` | `LOGCHEF_CONTEXT` | Use a specific context |
| `--server` | `LOGCHEF_SERVER_URL` | Override server URL (ephemeral) |
| `--token` | `LOGCHEF_AUTH_TOKEN` | Override API token |
| | `LOGCHEF_DEFAULT_TEAM` | Default team when `--team` is omitted |
| | `LOGCHEF_DEFAULT_SOURCE` | Default source when `--source` is omitted |
| `--quiet` / `-q` | | Suppress stats, highlighting, and spinners (data still goes to stdout) |
| `--debug` / `-d` | | Enable detailed debug output |
`--quiet` is the flag to reach for in scripts and agents: it strips the stderr stats line, ANSI highlighting, and progress spinners, leaving just the data on stdout. Pair it with `--output jsonl` for clean, parseable output:
```bash
logchef query 'level="error"' --quiet --output jsonl | jq .msg
```
## Environment Variables
[Section titled “Environment Variables”](#environment-variables)
For CI/CD pipelines and automation, you can configure the CLI entirely via environment variables:
```bash
# Option 1: Use a saved context
export LOGCHEF_CONTEXT="prod"
logchef query 'level="error"' --team "production" --source "app-logs"
# Option 2: Ephemeral mode (no saved context needed)
export LOGCHEF_SERVER_URL="https://logs.example.com"
export LOGCHEF_AUTH_TOKEN="logchef_1_abc123..."
logchef query 'level="error"' --team "production" --source "app-logs"
# Optional defaults for stateless automation
export LOGCHEF_DEFAULT_TEAM="production"
export LOGCHEF_DEFAULT_SOURCE="app-logs"
logchef query 'level="error"'
```
## Scripting Examples
[Section titled “Scripting Examples”](#scripting-examples)
### Export logs to file
[Section titled “Export logs to file”](#export-logs-to-file)
```bash
logchef query 'status=500' --output jsonl > errors.jsonl
```
### Count errors with jq
[Section titled “Count errors with jq”](#count-errors-with-jq)
```bash
logchef query 'level="error"' --output json | jq '.count'
```
### Extract specific fields with jq
[Section titled “Extract specific fields with jq”](#extract-specific-fields-with-jq)
```bash
# Get all unique hosts from JSON output
logchef query 'status=500' --output json | jq -r '.logs[].host' | sort -u
# Get all unique hosts from JSONL output
logchef query 'status=500' --output jsonl | jq -r '.host' | sort -u
# Pretty print messages
logchef query 'level="error"' --output jsonl | jq '.msg'
# Get query stats
logchef query "" --output json | jq '.stats'
```
### Pipe to grep for filtering
[Section titled “Pipe to grep for filtering”](#pipe-to-grep-for-filtering)
```bash
logchef query "" --no-highlight | grep -i "database"
```
### Clean output without timestamps
[Section titled “Clean output without timestamps”](#clean-output-without-timestamps)
```bash
logchef query 'level="error"' --no-timestamp --no-highlight > errors.txt
```
### Loop through multiple sources
[Section titled “Loop through multiple sources”](#loop-through-multiple-sources)
```bash
for source in "nginx-logs" "app-logs" "api-logs"; do
echo "=== Source: $source ==="
logchef query 'level="error"' --source "$source" --limit 5
done
```
## Next steps
[Section titled “Next steps”](#next-steps)
* Learn the filter syntax the `query` command accepts in [Search Syntax](/guide/search-syntax)
* Query a VictoriaLogs source end to end in the [VictoriaLogs tutorial](/tutorials/victorialogs/)
* Connect an AI assistant to the same data with the [MCP Server](/integration/mcp-server)
* Enable browser sign-in on the server with [Logchef OAuth](/getting-started/configuration/#logchef-oauth)
# Docker Logs
> Collect Docker container logs with Vector, store them in ClickHouse or VictoriaLogs, and explore them in Logchef.
[Vector](https://vector.dev)’s `docker_logs` source connects to the Docker daemon socket and streams stdout/stderr from every running container, no log driver configuration needed. This is the simplest path from plain Docker (or Docker Compose) hosts into ClickHouse or VictoriaLogs for querying with Logchef.
## Prerequisites
[Section titled “Prerequisites”](#prerequisites)
* ClickHouse or VictoriaLogs running and accessible
* Docker Engine with the daemon socket available (`/var/run/docker.sock`)
* A Logchef instance (for querying)
## Create the ClickHouse Table (ClickHouse only)
[Section titled “Create the ClickHouse Table (ClickHouse only)”](#create-the-clickhouse-table-clickhouse-only)
Skip this section when VictoriaLogs is your storage backend; it discovers fields from ingested events and does not need a table definition.
```sql
CREATE TABLE IF NOT EXISTS default.logs
(
timestamp DateTime64(3) CODEC(DoubleDelta, LZ4),
severity_text LowCardinality(String) CODEC(ZSTD(1)),
severity_number Int32 CODEC(ZSTD(1)),
service_name LowCardinality(String) CODEC(ZSTD(1)),
namespace LowCardinality(String) CODEC(ZSTD(1)),
body String CODEC(ZSTD(1)),
log_attributes Map(LowCardinality(String), String) CODEC(ZSTD(1)),
INDEX idx_severity_text severity_text TYPE set(100) GRANULARITY 4,
INDEX idx_log_attributes_keys mapKeys(log_attributes) TYPE bloom_filter(0.01) GRANULARITY 1,
INDEX idx_log_attributes_values mapValues(log_attributes) TYPE bloom_filter(0.01) GRANULARITY 1,
INDEX idx_body body TYPE tokenbf_v1(32768, 3, 0) GRANULARITY 1
)
ENGINE = MergeTree()
PARTITION BY toDate(timestamp)
ORDER BY (namespace, service_name, timestamp)
TTL toDateTime(timestamp) + INTERVAL 30 DAY
SETTINGS index_granularity = 8192, ttl_only_drop_parts = 1;
```
This is Logchef’s [OpenTelemetry schema](/integration/schema-design) — see that page for field and codec details.
## Configure Vector
[Section titled “Configure Vector”](#configure-vector)
```toml
[api]
enabled = true
# Source: stream logs from every container
[sources.docker_logs]
type = "docker_logs"
include_containers = ["*"]
# Transform: map to the OTEL schema
[transforms.remap_docker_logs]
inputs = ["docker_logs"]
type = "remap"
source = '''
.timestamp = .timestamp
.service_name = .container_name
.namespace = "docker"
.body = .message
.severity_text = if match(.message, r"(?i)error|exception|fail|critical") {
"ERROR"
} else if match(.message, r"(?i)warn") {
"WARN"
} else if match(.message, r"(?i)debug") {
"DEBUG"
} else {
"INFO"
}
.severity_number = if .severity_text == "ERROR" {
17
} else if .severity_text == "WARN" {
13
} else if .severity_text == "DEBUG" {
5
} else {
9
}
.log_attributes = {
"container.id": .container_id,
"container.image": .image,
"docker.stream": .stream
}
del(.message)
del(.source_type)
'''
# Sink: ship to ClickHouse
[sinks.clickhouse]
type = "clickhouse"
inputs = ["remap_docker_logs"]
endpoint = "http://clickhouse:8123"
database = "default"
table = "logs"
compression = "gzip"
healthcheck.enabled = false
skip_unknown_fields = true
```
### VictoriaLogs sink
[Section titled “VictoriaLogs sink”](#victorialogs-sink)
To store the same normalized container events in VictoriaLogs, add this sink and either keep the ClickHouse sink for dual-write or remove it:
```toml
[sinks.victorialogs]
type = "elasticsearch"
inputs = ["remap_docker_logs"]
endpoints = ["http://victorialogs:9428/insert/elasticsearch/"]
api_version = "v8"
mode = "bulk"
compression = "gzip"
[sinks.victorialogs.healthcheck]
enabled = false
[sinks.victorialogs.request.headers]
VL-Stream-Fields = "namespace,service_name"
VL-Time-Field = "timestamp"
VL-Msg-Field = "body"
```
This maps `timestamp` to VictoriaLogs’ `_time` and `body` to `_msg`, while keeping the other event fields queryable. Keep the stream-field list stable and low-cardinality; do not add container IDs, request IDs, or trace IDs.
Vector’s `docker_logs` source emits `container_id`, `container_name`, `image`, `stream` (`stdout`/`stderr`), `label` (container labels as an object), and a `timestamp` already parsed from the Docker log entry. Use `include_containers` / `exclude_containers` (prefix match) or `include_images` / `include_labels` to scope collection to specific services instead of `["*"]`.
## Run with Docker Compose
[Section titled “Run with Docker Compose”](#run-with-docker-compose)
Mount the Docker socket read-only so Vector can talk to the daemon. This example starts both storage backends; keep the one your Vector config targets, or use both sinks to compare them in one Logchef dashboard:
```yaml
services:
vector:
image: timberio/vector:latest-alpine
volumes:
- ./vector.toml:/etc/vector/vector.toml:ro
- /var/run/docker.sock:/var/run/docker.sock:ro
command: ["--config", "/etc/vector/vector.toml"]
restart: unless-stopped
clickhouse:
image: clickhouse/clickhouse-server:latest
ports:
- "8123:8123"
- "9000:9000"
volumes:
- clickhouse-data:/var/lib/clickhouse
victorialogs:
image: victoriametrics/victoria-logs:latest
command:
- -storageDataPath=/victoria-logs-data
- -retentionPeriod=30d
ports:
- "9428:9428"
volumes:
- victorialogs-data:/victoria-logs-data
volumes:
clickhouse-data:
victorialogs-data:
```
Or run Vector standalone against an existing Docker host:
```bash
docker run -d \
--name vector \
-v $(pwd)/vector.toml:/etc/vector/vector.toml:ro \
-v /var/run/docker.sock:/var/run/docker.sock:ro \
timberio/vector:latest-alpine \
--config /etc/vector/vector.toml
```
## Adding Container Labels
[Section titled “Adding Container Labels”](#adding-container-labels)
Docker labels (e.g. `com.docker.compose.service`, or your own `env=production`) are available on the event as `.label`. Promote useful ones into `log_attributes` in the transform:
```toml
[transforms.remap_docker_logs]
inputs = ["docker_logs"]
type = "remap"
source = '''
# ... existing mapping from above ...
.log_attributes."compose.service" = .label."com.docker.compose.service" ?? "unknown"
.log_attributes.environment = .label.environment ?? "unknown"
'''
```
## Connect Logchef
[Section titled “Connect Logchef”](#connect-logchef)
Once logs are flowing:
1. Log in to Logchef
2. Go to **Sources > Add Source**
3. Add the ClickHouse table, the VictoriaLogs base URL, or one source for each
4. Create or select a team and assign the source
For VictoriaLogs, use timestamp field `_time` and severity field `severity_text`. If Logchef runs in the same compose project, use `http://victorialogs:9428` as the base URL rather than `localhost`.
Start querying:
```plaintext
namespace="docker" and severity_text="ERROR"
```
```plaintext
service_name="checkout-api" and log_attributes.docker.stream="stderr"
```
```plaintext
log_attributes."compose.service"="api" and body~"connection refused"
```
The same LogchefQL filters work on the VictoriaLogs source. You can also switch that source to native LogsQL:
```text
namespace:="docker" AND severity_text:="ERROR" | fields _time, service_name, _msg
```
## Next steps
[Section titled “Next steps”](#next-steps)
* Running in Kubernetes instead of plain Docker? See [Kubernetes Logs](/integration/kubernetes)
* Already run an OpenTelemetry pipeline? See [OpenTelemetry Collector](/integration/otel-collector)
* Review [Schema Design](/integration/schema-design) and [Search Syntax](/guide/search-syntax) for more
# Kubernetes Logs
> Collect Kubernetes pod and container logs into ClickHouse with the OpenTelemetry Collector or Vector, then explore them in Logchef.
Kubernetes writes every container’s stdout/stderr to a log file on the node (`/var/log/pods/__//*.log`). A DaemonSet-deployed agent tails these files on every node, enriches them with pod metadata, and ships them to ClickHouse. Logchef doesn’t collect anything itself — it only queries the resulting table.
Two common agents do this well: the **OpenTelemetry Collector** (if you already run OTel for traces/metrics) or **Vector** (lighter-weight, purpose-built log shipper). Pick one.
## Prerequisites
[Section titled “Prerequisites”](#prerequisites)
* ClickHouse server reachable from the cluster
* A Logchef instance (for querying)
* Cluster admin access to create a DaemonSet, ServiceAccount, and ClusterRole
- OpenTelemetry Collector
## Option A: OpenTelemetry Collector DaemonSet
[Section titled “Option A: OpenTelemetry Collector DaemonSet”](#option-a-opentelemetry-collector-daemonset)
The `filelog` receiver tails container log files, and its `container` operator auto-detects the Docker/CRI-O/containerd log format and extracts `k8s.pod.name`, `k8s.namespace.name`, and `k8s.container.name` directly from the file path — no API access required for that part.
### Collector Config
[Section titled “Collector Config”](#collector-config)
```yaml
receivers:
filelog:
include:
- /var/log/pods/*/*/*.log
exclude:
- /var/log/pods/*/otel-collector/*.log
start_at: end
include_file_path: true
operators:
- type: container
id: container-parser
processors:
batch:
timeout: 5s
k8sattributes:
passthrough: false
extract:
metadata:
- k8s.namespace.name
- k8s.pod.name
- k8s.deployment.name
- k8s.node.name
pod_association:
- sources:
- from: resource_attribute
name: k8s.pod.name
exporters:
clickhouse:
endpoint: tcp://clickhouse:9000?dial_timeout=10s
database: otel
logs_table_name: otel_logs
ttl: 168h
create_schema: true
service:
pipelines:
logs:
receivers: [filelog]
processors: [k8sattributes, batch]
exporters: [clickhouse]
```
The `k8sattributes` processor is optional but useful for metadata the file path doesn’t carry — Deployment/Node names, pod labels, annotations. It queries the Kubernetes API, so it needs RBAC (below).
### DaemonSet Manifest
[Section titled “DaemonSet Manifest”](#daemonset-manifest)
```yaml
apiVersion: apps/v1
kind: DaemonSet
metadata:
name: otel-collector
namespace: observability
spec:
selector:
matchLabels:
app: otel-collector
template:
metadata:
labels:
app: otel-collector
spec:
serviceAccountName: otel-collector
containers:
- name: otel-collector
image: otel/opentelemetry-collector-contrib:latest
args: ["--config=/etc/otel/config.yaml"]
volumeMounts:
- name: config
mountPath: /etc/otel
- name: varlogpods
mountPath: /var/log/pods
readOnly: true
volumes:
- name: config
configMap:
name: otel-collector-config
- name: varlogpods
hostPath:
path: /var/log/pods
```
### RBAC (required for `k8sattributes`)
[Section titled “RBAC (required for k8sattributes)”](#rbac-required-for-k8sattributes)
```yaml
apiVersion: v1
kind: ServiceAccount
metadata:
name: otel-collector
namespace: observability
---
apiVersion: rbac.authorization.k8s.io/v1
kind: ClusterRole
metadata:
name: otel-collector
rules:
- apiGroups: [""]
resources: ["pods", "namespaces", "nodes"]
verbs: ["get", "watch", "list"]
- apiGroups: ["apps"]
resources: ["replicasets", "deployments", "statefulsets", "daemonsets"]
verbs: ["get", "list", "watch"]
---
apiVersion: rbac.authorization.k8s.io/v1
kind: ClusterRoleBinding
metadata:
name: otel-collector
roleRef:
apiGroup: rbac.authorization.k8s.io
kind: ClusterRole
name: otel-collector
subjects:
- kind: ServiceAccount
name: otel-collector
namespace: observability
```
See [OpenTelemetry Collector](/integration/otel-collector) for the full `clickhouseexporter` reference and the `otel_logs` schema this creates.
- Vector
## Option B: Vector DaemonSet
[Section titled “Option B: Vector DaemonSet”](#option-b-vector-daemonset)
Vector’s `kubernetes_logs` source tails pod logs and automatically enriches each event with pod/namespace/container metadata via the Kubernetes API (`/api/v1/pods`, `/api/v1/namespaces`, `/api/v1/nodes`).
### Vector Config
[Section titled “Vector Config”](#vector-config)
```toml
[sources.k8s_logs]
type = "kubernetes_logs"
[transforms.remap_k8s_logs]
inputs = ["k8s_logs"]
type = "remap"
source = '''
.service_name = .kubernetes.pod_labels."app.kubernetes.io/name" ?? .kubernetes.container_name
.namespace = .kubernetes.pod_namespace
.body = .message
.severity_text = if match(.message, r"(?i)error|exception|fail") {
"ERROR"
} else if match(.message, r"(?i)warn") {
"WARN"
} else {
"INFO"
}
.severity_number = if .severity_text == "ERROR" {
17
} else if .severity_text == "WARN" {
13
} else {
9
}
.log_attributes = {
"k8s.pod.name": .kubernetes.pod_name,
"k8s.container.name": .kubernetes.container_name,
"k8s.node.name": get_hostname!(),
"k8s.stream": .stream
}
del(.message)
del(.kubernetes)
del(.source_type)
del(.file)
'''
[sinks.clickhouse]
type = "clickhouse"
inputs = ["remap_k8s_logs"]
endpoint = "http://clickhouse:8123"
database = "default"
table = "logs"
compression = "gzip"
skip_unknown_fields = true
```
This targets the same `logs` table from [Shipping Logs with Vector](/integration/vector) — reuse that table’s `CREATE TABLE` statement.
### DaemonSet
[Section titled “DaemonSet”](#daemonset)
The official [Vector Helm chart](https://vector.dev/docs/setup/installation/package-managers/helm/) ships a ready-made `vector-agent` DaemonSet with the RBAC and volume mounts already wired up:
```bash
helm repo add vector https://helm.vector.dev
helm install vector vector/vector \
--set role=Agent \
--set-file customConfig=vector.toml
```
If you’d rather write the manifest by hand, Vector needs read/list/watch on `pods`, `namespaces`, and `nodes`, plus a hostPath mount for `/var/log/pods` and `/var/log/containers` — the same shape as the RBAC block in the Collector tab above, minus the `apps`/`batch` groups.
## Connect Logchef
[Section titled “Connect Logchef”](#connect-logchef)
Once logs are flowing into ClickHouse:
1. Log in to Logchef
2. Go to **Sources > Add Source**
3. Enter the ClickHouse connection details (host, port, database, table)
4. Create or select a team and assign the source
Start querying:
```plaintext
namespace="payments" and severity_text="ERROR"
```
```plaintext
log_attributes.k8s.container.name="checkout" and body~"panic"
```
If you used the OpenTelemetry Collector’s default `otel_logs` schema instead, query the `ResourceAttributes`/`LogAttributes` columns as described in [OpenTelemetry Collector](/integration/otel-collector).
## Next steps
[Section titled “Next steps”](#next-steps)
* See the full `clickhouseexporter` config and schema in [OpenTelemetry Collector](/integration/otel-collector)
* Shipping from plain Docker hosts instead of Kubernetes? See [Docker Logs](/integration/docker)
* Review [Search Syntax](/guide/search-syntax) for the full operator reference
# MCP Server
> Connect AI assistants to Logchef with the built-in Model Context Protocol endpoint. Sign in with OAuth, then query logs, explore schemas, and investigate alerts.
Logchef serves a [Model Context Protocol](https://modelcontextprotocol.io/) endpoint at `/mcp`. AI assistants use it to query logs, read schemas, run LogchefQL, and inspect alerts. There is no separate process to install. The endpoint is part of the Logchef server.
```text
https://logchef.example.com/mcp
```
The endpoint uses the Streamable HTTP transport in stateless mode. It accepts `POST` requests and returns JSON. `GET` and `DELETE` return `405`. A request body can be up to 1 MiB.
## Authentication
[Section titled “Authentication”](#authentication)
The endpoint accepts Logchef OAuth access tokens and nothing else. The MCP client runs the OAuth flow:
1. The client sends you to the Logchef consent page in your browser.
2. You sign in to Logchef (SSO or local login) and review the request.
3. You choose **Approve** or **Deny**.
4. The client receives a short-lived access token (10 minutes) and a refresh token (30 days).
The consent page shows the client name, the address the browser returns to, and the exact scopes. For a client that identifies itself with a URL, it also shows “Published by” and the host of that URL. Approve only a connection that you started yourself.
These credentials get `401` at `/mcp`:
* API tokens, including [service tokens](/features/service-tokens).
* Browser session cookies.
* OAuth tokens issued for the CLI. Those tokens work only for `/api`.
An OAuth token for `/mcp` gets `401` at `/api`. The two are separate audiences.
To revoke an assistant, open **Settings → Connected apps** in the Logchef web UI and remove it. The next request from that assistant fails.
Note
The endpoint exists only when an operator has enabled OAuth. Without it, `/mcp` and unknown `/.well-known/*` paths return `404`. Refer to [Logchef OAuth](/getting-started/configuration#logchef-oauth) for the server settings.
## Connect a client
[Section titled “Connect a client”](#connect-a-client)
Each client has its own setup steps. Refer to [Agent Setup](/integration/agent-setup) for Claude Code, Codex, Cursor, Claude.ai, Claude Desktop, and ChatGPT.
## What an assistant can see
[Section titled “What an assistant can see”](#what-an-assistant-can-see)
An assistant acts with your identity and sees only what you can see.
* **Read-only.** Every tool reads data. No tool changes teams, sources, users, tokens, saved queries, or alerts.
* **Seven read scopes.** The consent page requests `profile:read`, `teams:read`, `sources:read`, `logs:read`, `saved_queries:read`, `collections:read`, and `alerts:read`. It can also request `offline_access`, which lets the client refresh the token without asking you again. Tools that need a scope the token does not hold do not appear in the tool list.
* **Team membership only.** An OAuth token sees the teams you belong to and the sources linked to those teams. This applies to admins too. An admin’s web session can open any team, but an admin’s agent token cannot.
* **Same limits as the web UI.** One MCP tool call ends after `query.mcp_call_timeout_seconds` (default 60, never more than `query.max_timeout_seconds`). Concurrency limits follow `query.max_concurrent_per_user` and `query.max_concurrent_global`.
Caution
Logs are untrusted text. A log line can contain instructions aimed at an assistant. Review what an assistant does with log content, and keep the assistants you connect to the minimum that you need.
## Available tools
[Section titled “Available tools”](#available-tools)
### Profile and metadata
[Section titled “Profile and metadata”](#profile-and-metadata)
| Tool | Description |
| ------------- | ------------------------------------------------------------------------------ |
| `get_profile` | The profile for this connection: a stable `id`, plus name and email when known |
| `get_teams` | Teams you belong to, with your role and member counts |
| `get_meta` | Server version and configuration details |
### Sources
[Section titled “Sources”](#sources)
| Tool | Description |
| ------------------- | ----------------------------------------------------- |
| `get_sources` | All sources you can access, across your teams |
| `get_team_sources` | Sources that belong to one team |
| `get_source_schema` | Columns and types, or discovered fields, for a source |
### Querying logs
[Section titled “Querying logs”](#querying-logs)
| Tool | Description |
| ------------------- | ---------------------------------------------------------------------- |
| `query_logs` | Run a source-native query: SQL for ClickHouse, LogsQL for VictoriaLogs |
| `get_log_histogram` | Log volume over time, with optional grouping |
| `get_log_context` | Log entries before and after a timestamp |
### LogchefQL
[Section titled “LogchefQL”](#logchefql)
| Tool | Description |
| --------------------- | ---------------------------------------------------------------------- |
| `query_logchefql` | Run a LogchefQL query |
| `translate_logchefql` | Translate LogchefQL to the source’s native language without running it |
| `validate_logchefql` | Check LogchefQL syntax without running it |
### Investigation and analysis
[Section titled “Investigation and analysis”](#investigation-and-analysis)
| Tool | Description |
| -------------------------- | ------------------------------------------------------------------------- |
| `get_field_values` | Top distinct values for one field in a time range |
| `get_all_field_dimensions` | Top values for all low-cardinality fields in one call |
| `top_values` | Top values for several fields in one call (up to 20 fields) |
| `compare_windows` | Run the same LogchefQL filter in two time windows and compare the samples |
| `open_investigation` | Open the [investigation panel](#investigation-panel) |
### Saved queries and alerts
[Section titled “Saved queries and alerts”](#saved-queries-and-alerts)
| Tool | Description |
| -------------------- | ---------------------------------------------------- |
| `list_saved_queries` | Saved queries you can see, optionally for one source |
| `get_saved_query` | One saved query by ID |
| `list_alerts` | Alert rules for a source |
| `get_alert_history` | Evaluation history for one alert |
The alert tools return an error when alerting is disabled on the server.
## Not included
[Section titled “Not included”](#not-included)
These capabilities are not part of the endpoint:
* **Administration.** There are no tools to manage teams, users, sources, or API tokens.
* **Writes.** There are no tools to create, change, or delete saved queries, collections, or alerts.
* **AI query generation.** The assistant that you connect writes the query. Logchef’s own [AI SQL assistant](/features/ai-sql-generation) is part of the web UI only.
* **Query telemetry.** There is no tool for ClickHouse `system.query_log`.
## Resources
[Section titled “Resources”](#resources)
Resources give an assistant read-only data without a tool call.
| URI template | Description |
| ---------------------------------------------------- | -------------------------- |
| `logchef://team/{team_id}/source/{source_id}/schema` | Schema for a source |
| `logchef://source/{source_id}/saved-queries` | Saved queries for a source |
| `logchef://saved-query/{query_id}` | One saved query |
## Prompts
[Section titled “Prompts”](#prompts)
Two prompts guide an investigation.
| Prompt | Arguments | Description |
| ------------------------- | -------------------------------------------------------------------------------- | ------------------------------------------------------------------ |
| `investigate_error_spike` | `team_id` and `source_id` (required), `time_range` (optional, default last hour) | Schema discovery, error volume, patterns, timeline, and root cause |
| `investigate_alert` | `alert_id` (required), `team_id` and `source_id` (optional) | Alert configuration, history, matching logs, and a summary |
## Investigation panel
[Section titled “Investigation panel”](#investigation-panel)
`open_investigation` opens an interactive panel inside the conversation, using [MCP Apps](https://modelcontextprotocol.io/extensions/apps/overview). In the panel you can:
* Browse your sources.
* Run bounded LogchefQL queries and read the results.
* Select a histogram interval or log rows.
* Compare two time windows.
* Attach the evidence you selected to the conversation.
The panel runs the requested query when it opens. If the assistant calls `open_investigation` again while the panel is open, the panel replaces its source, filter and time range with the new request, clears the previous selection and attached evidence, and runs the new query. The panel shows inline or in full screen, depending on the client. A client that does not support MCP Apps still gets the tool result as text.
The panel is one self-contained page. It has no access to external networks. It calls the same read-only tools as the assistant, with the same token.
## Next steps
[Section titled “Next steps”](#next-steps)
* Set up your client: [Agent Setup](/integration/agent-setup)
* Enable the endpoint on your server: [Logchef OAuth](/getting-started/configuration#logchef-oauth)
* Prefer a terminal workflow? See the [Logchef CLI](/integration/cli)
# OpenTelemetry Collector
> Ship logs to ClickHouse with the OpenTelemetry Collector's clickhouseexporter, then explore the otel_logs table in Logchef.
The [OpenTelemetry Collector](https://opentelemetry.io/docs/collector/) can receive, process, and export logs to ClickHouse using the `clickhouseexporter` from the [collector-contrib](https://github.com/open-telemetry/opentelemetry-collector-contrib) distribution. Since Logchef reads directly from ClickHouse, the Collector is a solid choice if your services already emit OpenTelemetry logs, or if you want a single pipeline that also carries traces and metrics.
## Prerequisites
[Section titled “Prerequisites”](#prerequisites)
* ClickHouse server running and accessible
* The `otelcol-contrib` binary (the `clickhouseexporter` ships only in the [contrib distribution](https://github.com/open-telemetry/opentelemetry-collector-releases/tree/main/distributions/otelcol-contrib), not core)
* A Logchef instance (for querying)
## Minimal Configuration
[Section titled “Minimal Configuration”](#minimal-configuration)
A collector config that accepts OTLP logs and exports them to ClickHouse:
```yaml
receivers:
otlp:
protocols:
grpc:
endpoint: 0.0.0.0:4317
http:
endpoint: 0.0.0.0:4318
processors:
batch:
timeout: 5s
send_batch_size: 10000
exporters:
clickhouse:
endpoint: tcp://localhost:9000?dial_timeout=10s
database: otel
logs_table_name: otel_logs
ttl: 72h
compress: lz4
async_insert: true
create_schema: true
service:
pipelines:
logs:
receivers: [otlp]
processors: [batch]
exporters: [clickhouse]
```
Run it:
```bash
otelcol-contrib --config config.yaml
```
With `create_schema: true` (the default), the exporter creates the `otel` database and `otel_logs` table on startup — you don’t need to run any DDL yourself.
## Exporter Configuration Reference
[Section titled “Exporter Configuration Reference”](#exporter-configuration-reference)
| Option | Default | Description |
| ----------------------- | ------------- | -------------------------------------------------------------------------------------------------------------------------------------------------- |
| `endpoint` | (required) | ClickHouse address. Supports the native protocol (`tcp://host:9000`), HTTP (`http://host:8123`), or `clickhouse://host:9000` with TLS/query params |
| `username` / `password` | empty | Authentication credentials |
| `database` | `default` | Target database |
| `logs_table_name` | `otel_logs` | Destination table for logs |
| `ttl` | none | Data retention, e.g. `72h`, `30m` |
| `compress` | `lz4` | Compression: `none`, `zstd`, `lz4`, `gzip`, `deflate`, `br` |
| `async_insert` | `true` | Use ClickHouse async inserts for higher write throughput |
| `create_schema` | `true` | Auto-create the database and tables on startup |
| `table_engine` | `MergeTree()` | Override the table engine (e.g. for `ReplicatedMergeTree` in a cluster) |
| `cluster_name` | empty | Appends `ON CLUSTER ` to DDL statements |
| `timeout` | `5s` | Per-request timeout |
| `connection_params` | `{}` | Extra native-protocol params, e.g. `{"dial_timeout": "10s"}` |
For high-volume pipelines, tune the exporter’s own batching instead of adding a second `batch` processor stage for it — an oversized processor-level batch plus the exporter’s internal queue can double-buffer and increase the risk of data loss on crash:
```yaml
exporters:
clickhouse:
# ...
sending_queue:
enabled: true
num_consumers: 10
queue_size: 1000
batch:
min_size: 5000
flush_timeout: 5s
retry_on_failure:
enabled: true
initial_interval: 5s
max_interval: 30s
max_elapsed_time: 300s
```
## The `otel_logs` Schema
[Section titled “The otel\_logs Schema”](#the-otel_logs-schema)
When `create_schema` is enabled, the exporter creates a table shaped like this (columns trimmed to the ones you’ll actually query from Logchef):
```sql
CREATE TABLE IF NOT EXISTS otel.otel_logs
(
`Timestamp` DateTime64(9) CODEC(Delta(8), ZSTD(1)),
`TraceId` String CODEC(ZSTD(1)),
`SpanId` String CODEC(ZSTD(1)),
`TraceFlags` UInt8,
`SeverityText` LowCardinality(String) CODEC(ZSTD(1)),
`SeverityNumber` UInt8,
`ServiceName` LowCardinality(String) CODEC(ZSTD(1)),
`Body` String CODEC(ZSTD(1)),
`ResourceSchemaUrl` LowCardinality(String) CODEC(ZSTD(1)),
`ResourceAttributes` Map(LowCardinality(String), String) CODEC(ZSTD(1)),
`ScopeSchemaUrl` LowCardinality(String) CODEC(ZSTD(1)),
`ScopeName` String CODEC(ZSTD(1)),
`ScopeVersion` LowCardinality(String) CODEC(ZSTD(1)),
`ScopeAttributes` Map(LowCardinality(String), String) CODEC(ZSTD(1)),
`LogAttributes` Map(LowCardinality(String), String) CODEC(ZSTD(1)),
`EventName` String CODEC(ZSTD(1)),
INDEX idx_trace_id TraceId TYPE bloom_filter(0.001) GRANULARITY 1,
INDEX idx_res_attr_key mapKeys(ResourceAttributes) TYPE bloom_filter(0.01) GRANULARITY 1,
INDEX idx_res_attr_value mapValues(ResourceAttributes) TYPE bloom_filter(0.01) GRANULARITY 1,
INDEX idx_log_attr_key mapKeys(LogAttributes) TYPE bloom_filter(0.01) GRANULARITY 1,
INDEX idx_log_attr_value mapValues(LogAttributes) TYPE bloom_filter(0.01) GRANULARITY 1,
INDEX idx_lower_body lower(Body) TYPE tokenbf_v1(32768, 3, 0) GRANULARITY 8
)
ENGINE = MergeTree()
PARTITION BY toDate(Timestamp)
ORDER BY (toStartOfFiveMinutes(Timestamp), ServiceName, Timestamp)
SETTINGS index_granularity = 8192, ttl_only_drop_parts = 1;
```
This maps cleanly onto Logchef’s [OpenTelemetry schema](/integration/schema-design): `Timestamp` is the required time column, `SeverityText`/`ServiceName` are `LowCardinality` for fast filtering, and `ResourceAttributes`/`LogAttributes` are `Map` columns for flexible key-value data. Resource-level fields like `k8s.pod.name` or `deployment.environment.name` land in `ResourceAttributes`; per-record fields set by instrumentation land in `LogAttributes`.
If you’d rather use Logchef’s `log_attributes`/`namespace`/`body` naming instead of the exporter’s PascalCase columns, either pre-create the table yourself (set `create_schema: false`) using the schema from [Schema Design](/integration/schema-design), or add a `transform` processor to rename fields before export.
## Parsing Existing Text Logs
[Section titled “Parsing Existing Text Logs”](#parsing-existing-text-logs)
If your services write plain-text or JSON log files rather than emitting OTLP directly, use the `filelog` receiver with parsing operators to turn them into log records first:
```yaml
receivers:
filelog:
include: ["/var/log/myapp/*.log"]
start_at: beginning
operators:
- type: json_parser
timestamp:
parse_from: attributes.time
layout: "%Y-%m-%dT%H:%M:%S.%fZ"
severity:
parse_from: attributes.level
processors:
batch:
timeout: 5s
exporters:
clickhouse:
endpoint: tcp://localhost:9000?dial_timeout=10s
database: otel
logs_table_name: otel_logs
create_schema: true
service:
pipelines:
logs:
receivers: [filelog]
processors: [batch]
exporters: [clickhouse]
```
`json_parser` merges parsed JSON fields into the log record’s attributes (`LogAttributes` in the exported row); swap in `regex_parser` for unstructured line formats.
## Connect Logchef
[Section titled “Connect Logchef”](#connect-logchef)
Once logs are flowing into ClickHouse:
1. Log in to Logchef
2. Go to **Sources > Add Source**
3. Enter the ClickHouse connection details — database `otel`, table `otel_logs`
4. Create or select a team and assign the source
Start querying:
```plaintext
SeverityText="ERROR" and ServiceName="checkout-api"
```
```plaintext
ResourceAttributes."k8s.namespace.name"="payments" and Body~"timeout"
```
```plaintext
LogAttributes.http_status_code>=500
```
See [Search Syntax](/guide/search-syntax) for the full dot-notation reference on `Map` columns, and [Query Examples](/guide/examples) for more.
## Next steps
[Section titled “Next steps”](#next-steps)
* Collecting logs from a Kubernetes cluster? See [Kubernetes Logs](/integration/kubernetes)
* Prefer a lighter-weight agent? See [Shipping Logs with Vector](/integration/vector)
* Review [Schema Design](/integration/schema-design) for field types, codecs, and indexing choices
# Schema Design
> Understand ClickHouse schema design and optimization for fast, storage-efficient log analytics with Logchef.
Logchef works with any ClickHouse table that has a timestamp field. If you don’t have an existing schema, or want to start ingesting logs quickly without worrying about the details, you can use the optimized built-in schemas Logchef provides.
## OpenTelemetry Schema
[Section titled “OpenTelemetry Schema”](#opentelemetry-schema)
Our default schema is optimized for OpenTelemetry logs, providing a balance between query performance and storage efficiency:
```sql
CREATE TABLE "{{database_name}}"."{{table_name}}" (
timestamp DateTime64(3) CODEC(DoubleDelta, LZ4),
trace_id String CODEC(ZSTD(1)),
span_id String CODEC(ZSTD(1)),
trace_flags UInt32 CODEC(ZSTD(1)),
severity_text LowCardinality(String) CODEC(ZSTD(1)),
severity_number Int32 CODEC(ZSTD(1)),
service_name LowCardinality(String) CODEC(ZSTD(1)),
namespace LowCardinality(String) CODEC(ZSTD(1)),
body String CODEC(ZSTD(1)),
log_attributes Map(LowCardinality(String), String) CODEC(ZSTD(1)),
INDEX idx_trace_id trace_id TYPE bloom_filter(0.001) GRANULARITY 1,
INDEX idx_severity_text severity_text TYPE set(100) GRANULARITY 4,
INDEX idx_log_attributes_keys mapKeys(log_attributes) TYPE bloom_filter(0.01) GRANULARITY 1,
INDEX idx_log_attributes_values mapValues(log_attributes) TYPE bloom_filter(0.01) GRANULARITY 1,
INDEX idx_body body TYPE tokenbf_v1(32768, 3, 0) GRANULARITY 1
)
ENGINE = MergeTree()
PARTITION BY toDate(timestamp)
ORDER BY (namespace, service_name, timestamp)
TTL toDateTime(timestamp) + INTERVAL {{ttl_day}} DAY
SETTINGS index_granularity = 8192, ttl_only_drop_parts = 1;
```
### Key Design Decisions
[Section titled “Key Design Decisions”](#key-design-decisions)
1. **Optimized Data Types**
* `DateTime64(3)` for microsecond precision timestamps
* `LowCardinality(String)` for fields with limited unique values
* `Map` type for flexible key-value attributes
2. **Efficient Compression**
* `DoubleDelta, LZ4` for timestamp compression
* `ZSTD(1)` for optimal compression of string and map fields
3. **Strategic Indexing**
```sql
INDEX idx_trace_id trace_id TYPE bloom_filter(0.001) GRANULARITY 1
INDEX idx_severity_text severity_text TYPE set(100) GRANULARITY 4
INDEX idx_log_attributes_keys mapKeys(log_attributes) TYPE bloom_filter(0.01) GRANULARITY 1
INDEX idx_log_attributes_values mapValues(log_attributes) TYPE bloom_filter(0.01) GRANULARITY 1
INDEX idx_body body TYPE tokenbf_v1(32768, 3, 0) GRANULARITY 1
```
4. **Partitioning and Ordering**
```sql
PARTITION BY toDate(timestamp)
ORDER BY (namespace, service_name, timestamp)
```
### Field Descriptions
[Section titled “Field Descriptions”](#field-descriptions)
* **`timestamp`**: The time the log event occurred. Must be `DateTime` or `DateTime64`. This is the **only strictly required field** for Logchef to function.
* **`severity_text` / `severity_number`**: Represents the log level (e.g., ‘INFO’, ‘ERROR’). Using `LowCardinality(String)` for `severity_text` is highly recommended for performance.
* **`service_name` / `namespace`**: Identifies the origin of the log. `LowCardinality(String)` improves query speed.
* **`body`**: The primary content of the log message.
* **`trace_id` / `span_id`**: Link logs to distributed traces if you are using OpenTelemetry tracing.
* **`log_attributes`**: A `Map` type for storing arbitrary key-value pairs associated with the log. This allows for flexible and structured logging without needing to alter the table schema frequently.
## Using Custom Schemas
[Section titled “Using Custom Schemas”](#using-custom-schemas)
Logchef works with any ClickHouse table structure. When connecting to an existing table:
1. Logchef automatically detects the schema
2. Adapts its query interface to your fields
3. Provides appropriate operators based on field types
Remember, you are **not required** to use Logchef’s schemas. Logchef can connect to any existing ClickHouse table as long as it has a `timestamp` column (`DateTime` or `DateTime64`). For optimal query performance with custom schemas, consider using `LowCardinality(String)` for frequently repeated text fields and a `Map` type for flexible attributes.
## Best Practices
[Section titled “Best Practices”](#best-practices)
1. **Field Types**
* Use `LowCardinality(String)` for enum-like fields
* Use appropriate numeric types (UInt16, Float64) for metrics
* Consider `Nullable` types if fields might be missing
2. **Compression**
* Use `ZSTD` for general string compression
* Use `DoubleDelta` for monotonic numeric sequences
* Adjust compression levels based on your needs
3. **Indexing**
* Add bloom filters for high-cardinality string fields
* Use set indices for low-cardinality fields
* Consider skip indices for frequently filtered columns
4. **Partitioning**
* Partition by date for easy data management
* Choose partition size based on data volume
* Consider TTL policies for data retention
## Next steps
[Section titled “Next steps”](#next-steps)
* See [Shipping Logs with Vector](/integration/vector) to ship logs into a table with this schema
* Follow [Shipping NGINX Logs to ClickHouse](/tutorials/nginx-logs) for a purpose-built schema example
* Review [Search Syntax](/guide/search-syntax) for how LogchefQL maps to Map and JSON columns
# Shipping Logs with Vector
> Collect, shape, and ship logs with Vector to ClickHouse or VictoriaLogs for querying with Logchef.
[Vector](https://vector.dev) is a lightweight, high-performance observability pipeline that can collect, transform, and route logs to ClickHouse or VictoriaLogs. Logchef queries either backend in place; Vector is the component that gets logs there.
## Quick Start
[Section titled “Quick Start”](#quick-start)
If you’re using the [Docker quick start](/getting-started/quickstart), Vector is already included and configured: demo syslog data flows into ClickHouse automatically. Skip to [Adapting for Real Sources](#adapting-for-real-sources) when you’re ready to ship your own logs, or add the [VictoriaLogs sink](#send-the-same-events-to-victorialogs) below.
For a standalone setup, you need three things:
1. A ClickHouse table with the right schema, or a reachable VictoriaLogs server
2. A Vector config that transforms and ships logs
3. Logchef pointed at the ClickHouse table or VictoriaLogs API
## Prerequisites
[Section titled “Prerequisites”](#prerequisites)
* ClickHouse or VictoriaLogs running and accessible
* [Vector installed](https://vector.dev/docs/setup/installation/) (v0.30+)
* A Logchef instance (for querying)
## Create the ClickHouse Table
[Section titled “Create the ClickHouse Table”](#create-the-clickhouse-table)
Logchef works with any ClickHouse table that has a timestamp column, but the built-in [OpenTelemetry schema](/integration/schema-design) gives you the best experience: severity filtering, service grouping, and flexible `log_attributes` all work out of the box.
Create the table:
```sql
CREATE TABLE IF NOT EXISTS default.logs
(
timestamp DateTime64(3) CODEC(DoubleDelta, LZ4),
severity_text LowCardinality(String) CODEC(ZSTD(1)),
severity_number Int32 CODEC(ZSTD(1)),
service_name LowCardinality(String) CODEC(ZSTD(1)),
namespace LowCardinality(String) CODEC(ZSTD(1)),
body String CODEC(ZSTD(1)),
log_attributes Map(LowCardinality(String), String) CODEC(ZSTD(1)),
INDEX idx_severity_text severity_text TYPE set(100) GRANULARITY 4,
INDEX idx_log_attributes_keys mapKeys(log_attributes) TYPE bloom_filter(0.01) GRANULARITY 1,
INDEX idx_log_attributes_values mapValues(log_attributes) TYPE bloom_filter(0.01) GRANULARITY 1,
INDEX idx_body body TYPE tokenbf_v1(32768, 3, 0) GRANULARITY 1
)
ENGINE = MergeTree()
PARTITION BY toDate(timestamp)
ORDER BY (namespace, service_name, timestamp)
TTL toDateTime(timestamp) + INTERVAL 30 DAY
SETTINGS index_granularity = 8192, ttl_only_drop_parts = 1;
```
See [Schema Design](/integration/schema-design) for details on field types, codecs, and indexing choices.
## Configure Vector
[Section titled “Configure Vector”](#configure-vector)
A minimal Vector config that collects syslog and ships to ClickHouse:
```toml
[api]
enabled = true
# Source: collect syslog
[sources.syslog_input]
type = "syslog"
address = "0.0.0.0:514"
mode = "udp"
# Transform: map to OTEL schema
[transforms.remap_logs]
inputs = ["syslog_input"]
type = "remap"
source = '''
structured = parse_syslog!(.message)
.timestamp = format_timestamp!(structured.timestamp, format: "%Y-%m-%d %H:%M:%S.%f")
.body = structured.message
.service_name = structured.appname
.namespace = "syslog"
# Map severity to standardized values
.severity_text = if includes(["emerg", "err", "crit", "alert"], structured.severity) {
"ERROR"
} else if structured.severity == "warning" {
"WARN"
} else if structured.severity == "debug" {
"DEBUG"
} else if includes(["info", "notice"], structured.severity) {
"INFO"
} else {
structured.severity
}
# OTEL severity numbers
# https://opentelemetry.io/docs/specs/otel/logs/data-model/#severity-fields
.severity_number = if .severity_text == "ERROR" {
17
} else if .severity_text == "WARN" {
13
} else if .severity_text == "DEBUG" {
5
} else {
9
}
# Store source-specific fields in log_attributes
.log_attributes = {
"syslog.procid": structured.procid,
"syslog.facility": structured.facility,
"syslog.version": structured.version,
"syslog.hostname": structured.hostname
}
del(.message)
del(.source_type)
'''
# Sink: ship to ClickHouse
[sinks.clickhouse]
type = "clickhouse"
inputs = ["remap_logs"]
endpoint = "http://localhost:8123"
database = "default"
table = "logs"
compression = "gzip"
healthcheck.enabled = false
skip_unknown_fields = true
```
Run Vector:
```bash
vector --config vector.toml
```
## Send the Same Events to VictoriaLogs
[Section titled “Send the Same Events to VictoriaLogs”](#send-the-same-events-to-victorialogs)
VictoriaLogs does not need a table schema. Point a second sink at the same `remap_logs` transform to dual-write the normalized event, or replace the ClickHouse sink if VictoriaLogs is your only store:
```toml
[sinks.victorialogs]
type = "elasticsearch"
inputs = ["remap_logs"]
endpoints = ["http://localhost:9428/insert/elasticsearch/"]
api_version = "v8"
mode = "bulk"
compression = "gzip"
[sinks.victorialogs.healthcheck]
enabled = false
[sinks.victorialogs.request.headers]
VL-Stream-Fields = "namespace,service_name"
VL-Time-Field = "timestamp"
VL-Msg-Field = "body"
```
The three VictoriaLogs headers tell the ingestion API how to map your event:
* `VL-Time-Field` becomes VictoriaLogs’ `_time`
* `VL-Msg-Field` becomes `_msg`
* `VL-Stream-Fields` defines stable stream identity
Keep stream fields low-cardinality. Service, environment, namespace, and host are good candidates; request IDs and trace IDs are not. All remaining event fields stay available for LogsQL and LogchefQL filters.
When Vector runs in a container, replace `localhost` with the VictoriaLogs service name on the shared Docker network. If your VictoriaLogs deployment is multi-tenant, add `AccountID` and `ProjectID` headers to this ingestion sink as well as to the Logchef source; writing to one tenant and querying another will look like successful ingestion followed by empty results.
Verify the pipeline at the storage API before configuring Logchef:
```bash
curl --fail --data-urlencode 'query=namespace:="syslog"' \
http://localhost:9428/select/logsql/query
```
Then add a VictoriaLogs source in Logchef with timestamp field `_time` and severity field `severity_text`. See [Using VictoriaLogs with Logchef](/tutorials/victorialogs) for source authentication, tenancy, immutable scope, and query modes.
## Adapting for Real Sources
[Section titled “Adapting for Real Sources”](#adapting-for-real-sources)
Replace the `[sources]` and `[transforms]` sections for your log source. The sink stays the same.
### File-based Logs
[Section titled “File-based Logs”](#file-based-logs)
```toml
[sources.file_logs]
type = "file"
include = ["/var/log/**/*.log"]
read_from = "beginning"
[transforms.remap_file_logs]
inputs = ["file_logs"]
type = "remap"
source = '''
.timestamp = now()
.service_name = "file_service"
.namespace = "files"
.body = .message
# Extract severity if present in the log line
severity_match = parse_regex(.message, r'^(?P